Long Term Monitoring Overview
Objective:
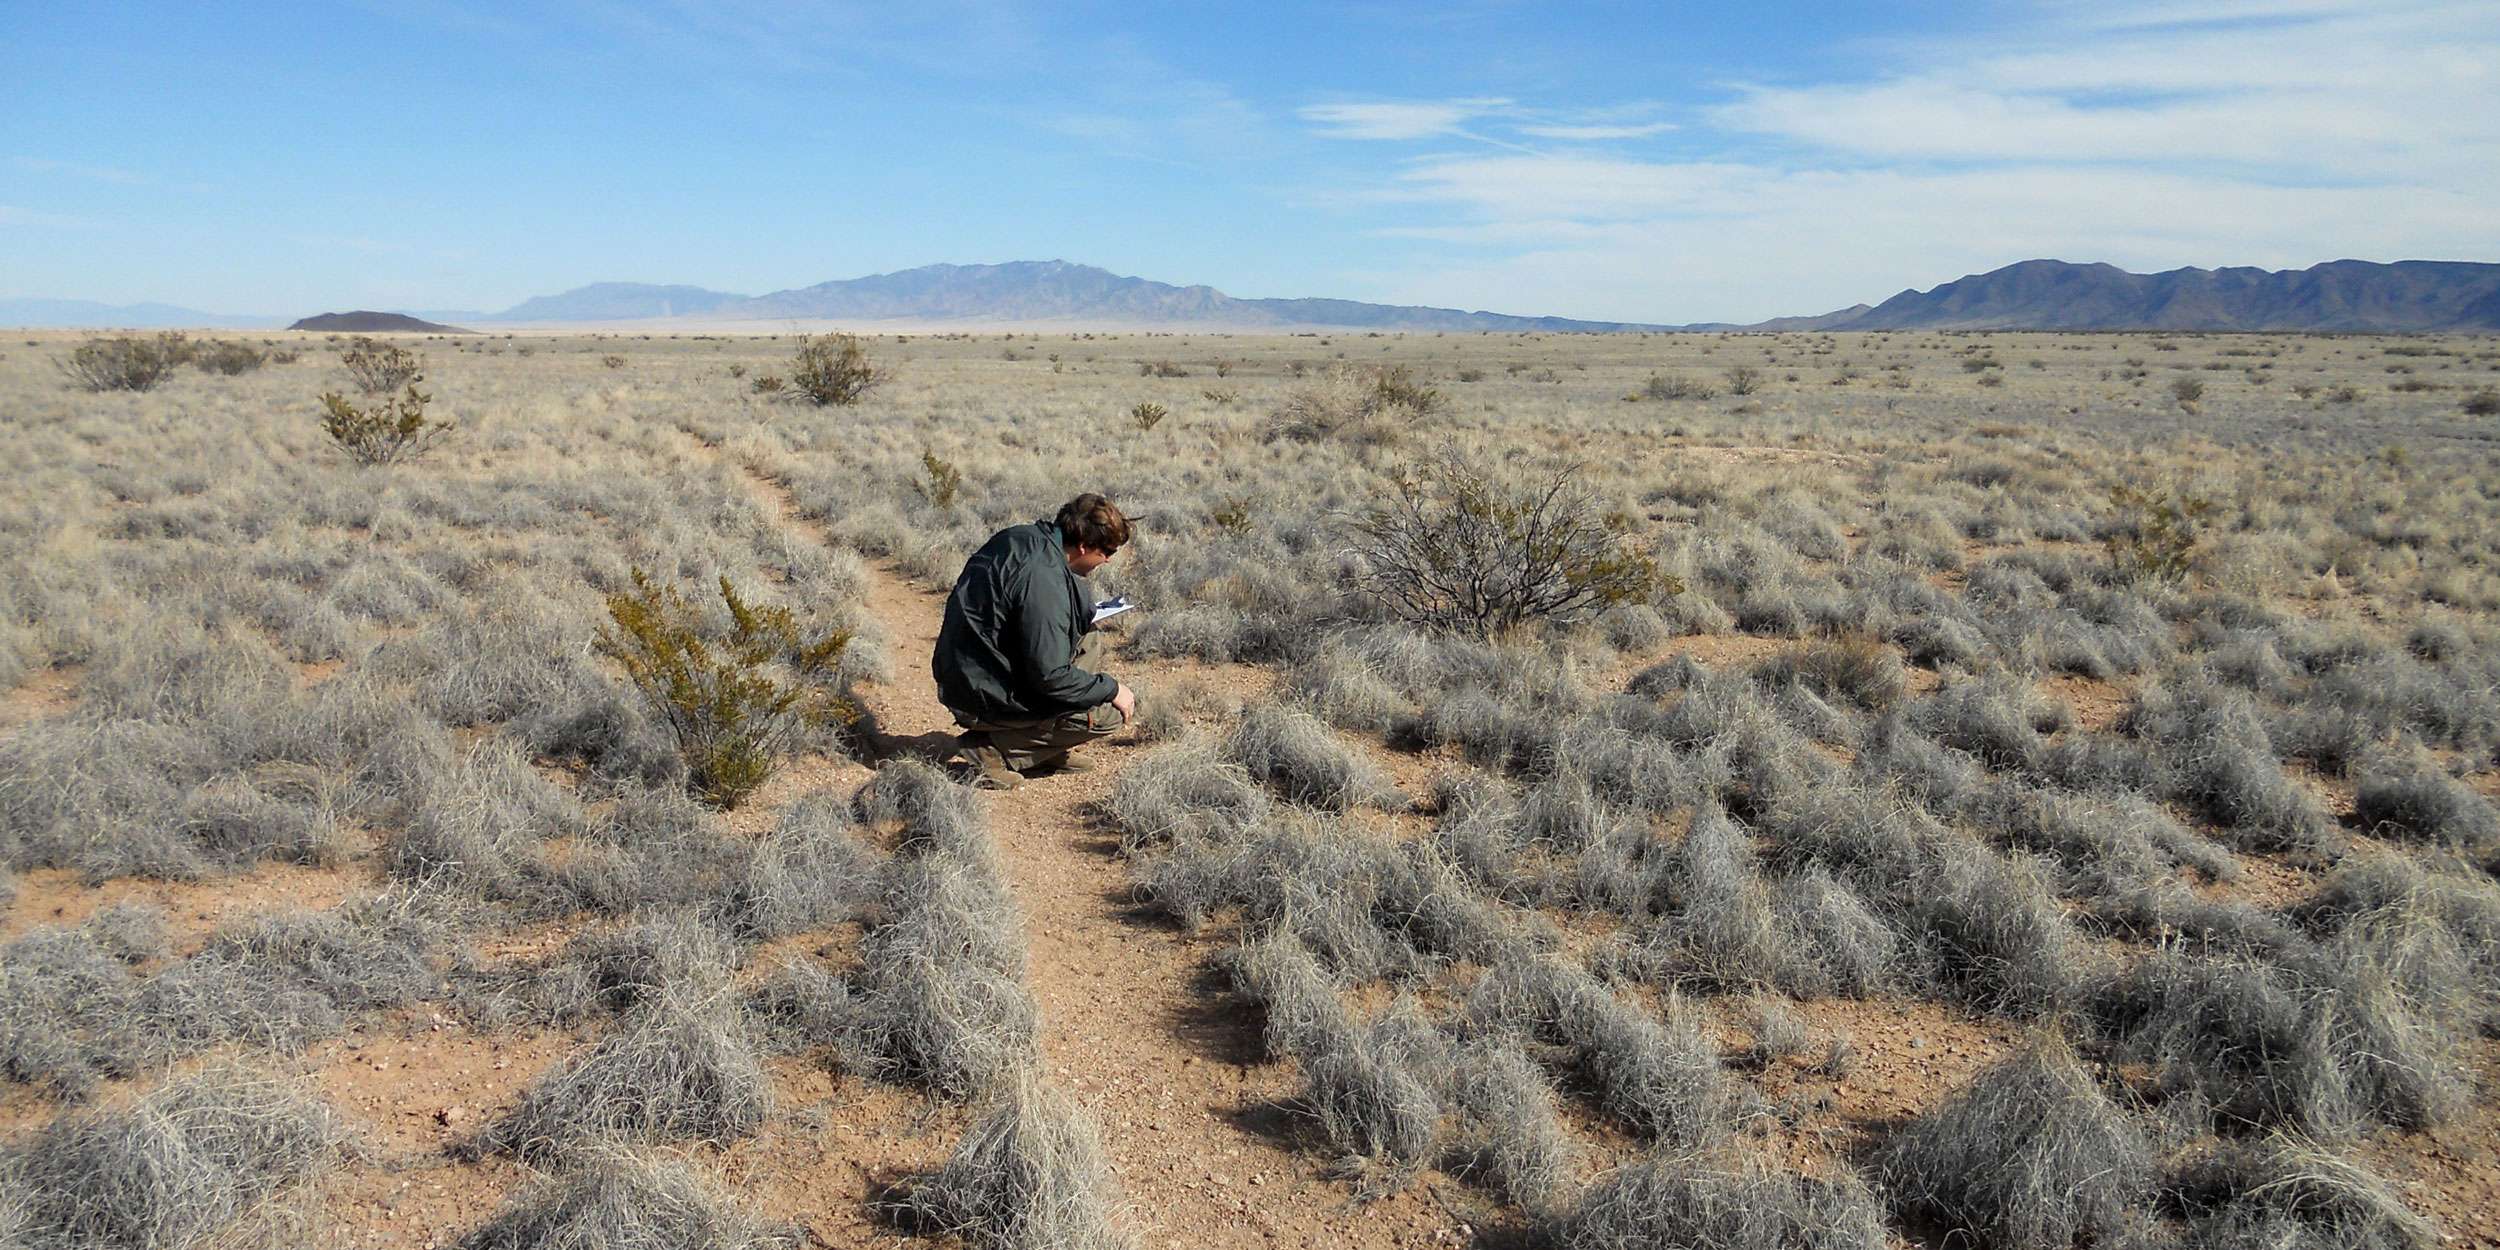
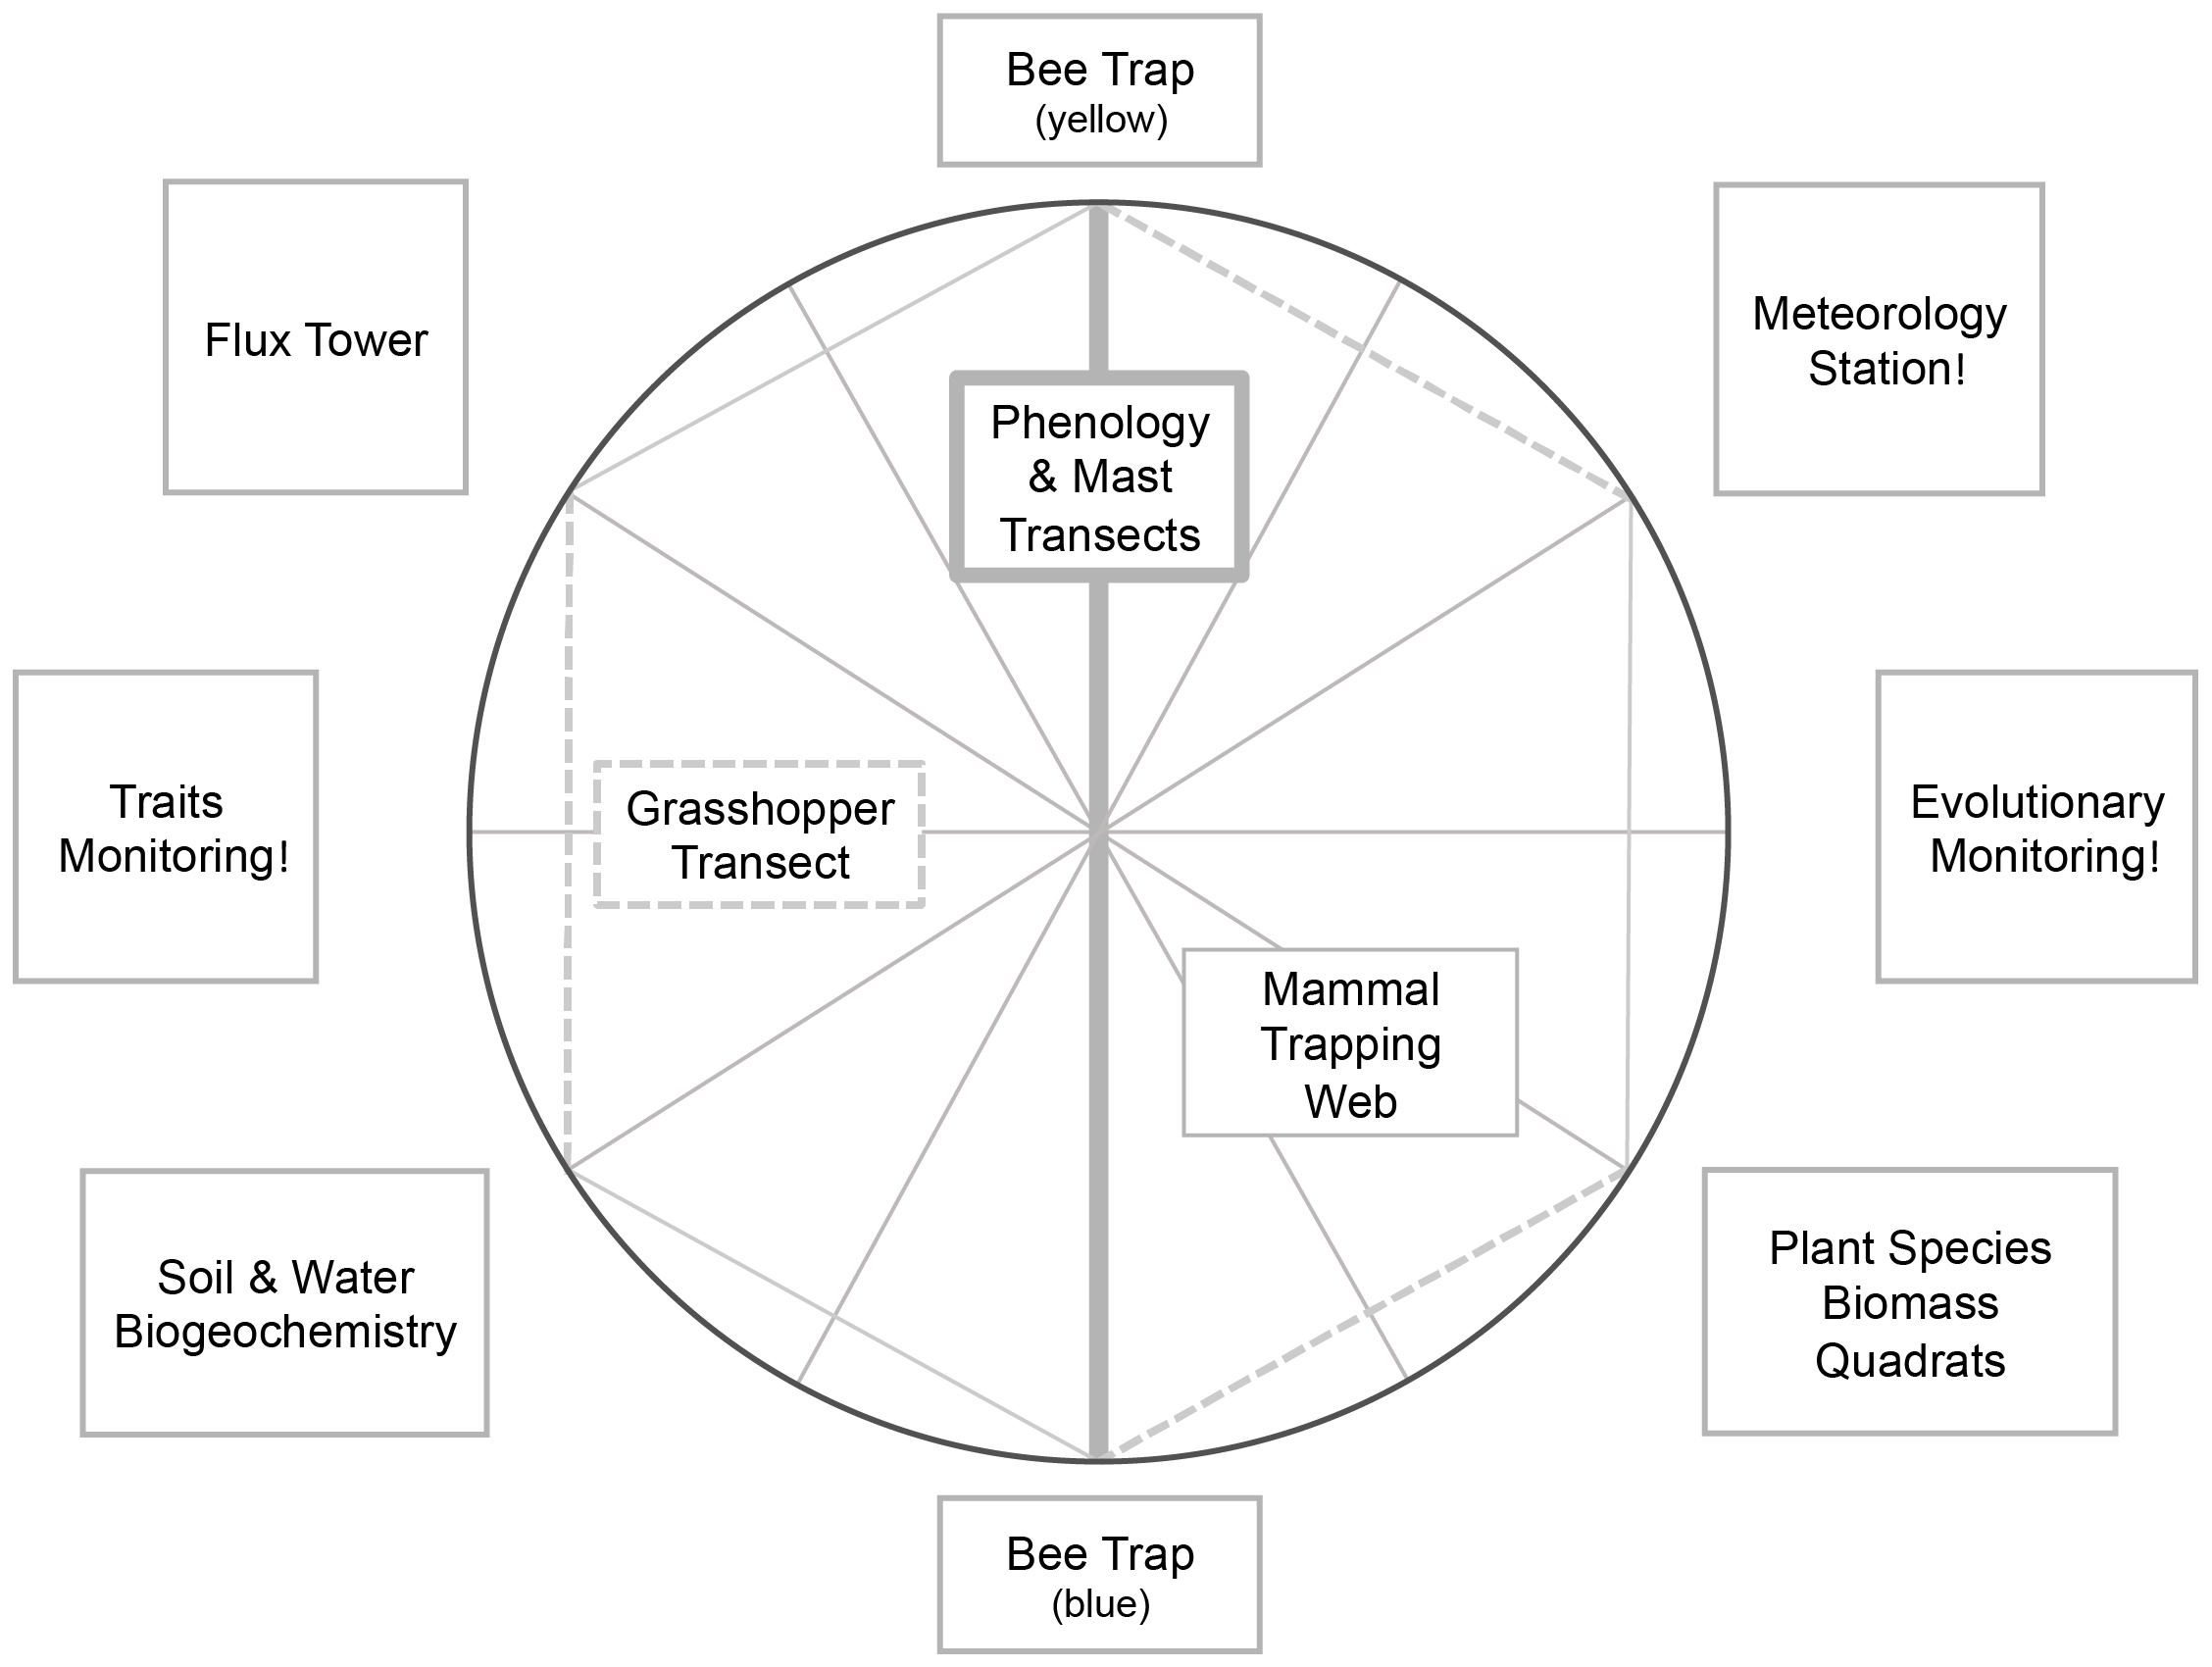
A meteorological station tracks hourly climate data, rodent trapping webs consisting of 145 Sherman traps catch rodents twice yearly, two passive funnel bee traps track the world’s longest continuously monitored bee community, 1m X 1m quadrats estimate plant biomass twice yearly for 265 plant species, and belt transects capture changes in plant phenology and grasshopper biodiversity.
Click the diagram below to learn more about core site research!
Long Term Monitoring Layers (AKA Core Sites):
Core Site Design
Core Site Evolutionary Monitoring
Experiments Overview
Global change happening NOW at SEV LTER!
SEV-LTER maintains eleven long-term manipulative experiments to investigate future scenarios of global change, including climate warming, altered precipitation regimes, extreme drought, nitrogen deposition, soil disturbance, and the loss of foundation plant species.
Historical Overview
We have led and supported past projects through the SEV LTER to understand how fire, drought, rainfall regime, native consumers, and both aeolian and water-driven sediment dynamics shape the dynamics of populations, communities, and ecosystems in the desert southwest. These pages describe past projects, some of which continue to provide new insights through data re-analyses.
Models Overview
We integrate our empirical work with dynamic models that span producers and consumers at population, community, and ecosystem levels. The motivation for this data-model interface is two-fold. First, the models function as tools for data analysis and integration, allowing us to project responses to manipulations of climate mean and variance at scales that cannot be directly observed. For example, the models enable tests of whether increased climate variance will accelerate or decelerate ecosystem transitions, even though these transitions may play out over decades or centuries. Second, the models function as tools to explore possible future scenarios that are not represented in our long-term observations or experiments. In this way, models facilitate general inferences that transcend the particular conditions represented by our empirical work. For example, we are using models to explore consequences of climate variance that are more (and less) extreme than the variance treatments in our signature Mean-Variance Experiment.
Model Overview:
Our three models predict WAVE: the spatial trajectories of ecosystem transitions, TECO: the ecosystem processes that result from plant community trait distributions and ecosystem transitions, and SDP: the influences of climate and plant community composition on consumer fitness and population dynamics (see Integration Figure). A unique feature of our modeling components is that we will use a Bayesian framework to assimilate data from both experiments and observations. This allows us to constrain the models and fully quantify uncertainty in a workflow that forecasts the long-term trajectories of SEV populations, communities, and ecosystems.
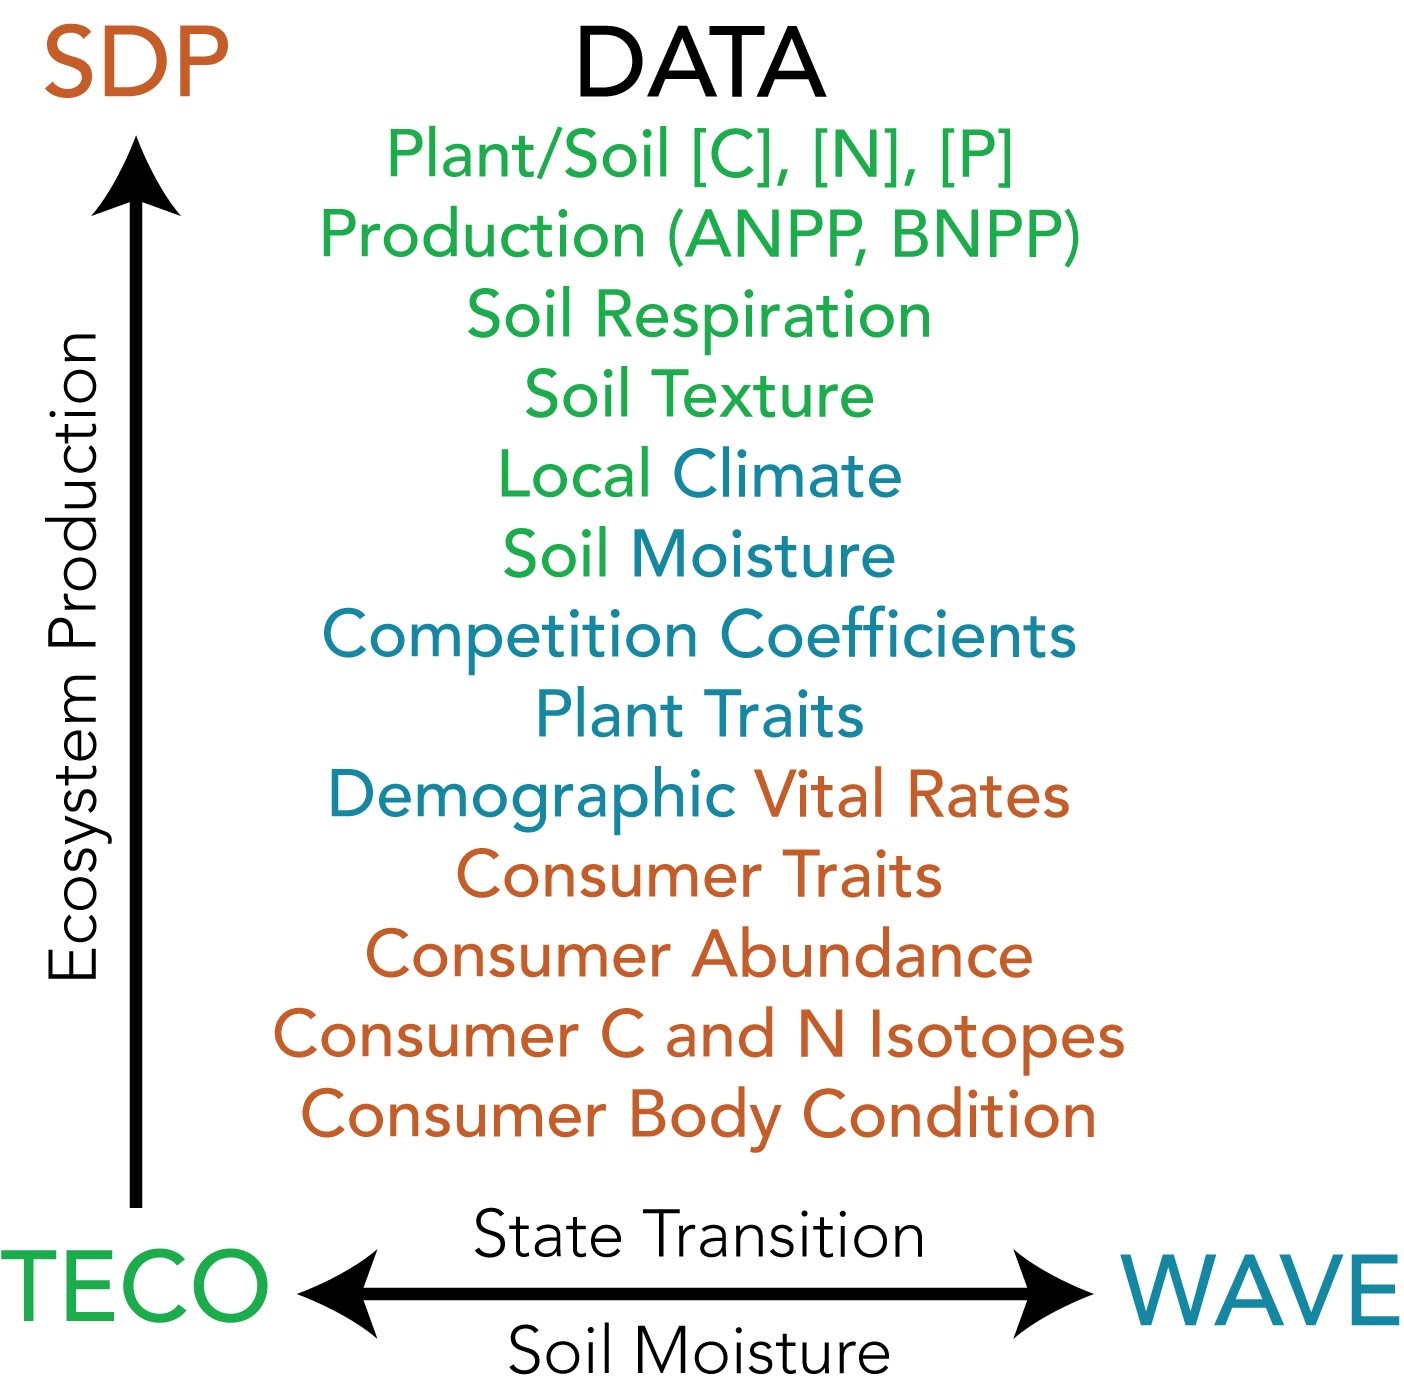
This Integration Figure illustrates interactions among SEV LTER three modeling approaches: WAVE, TECO, and SDP. Datasets that are used to inform and parameterize the models are listed in the middle.
Model Integration:
Each model can stand alone to evaluate how climate variability affects ecosystem transitions (WAVE), ecosystem processes (TECO), and consumer dynamics (SDP), respectively. Importantly, we also use these models to inform each other. WAVE predicts the trajectories of foundation plant species, which, in turn, control community trait distributions. By incorporating predicted state transitions and associated plant trait distributions into TECO, we link plant community changes to ecosystem process rates. We then can use outputs from TECO to feed back to WAVE to modify demographic transitions and competitive dynamics of foundation plants based on measured and inferred biophysical feedbacks (e.g., plant species influences on the soil moisture profile). Since ecosystem processes and ecosystem transitions determine food abundance and quality, results from the WAVE/TECO interface drive consumer dynamics in SDP. Altogether, we are using these models to provide an integrated understanding of how and why drylands respond to changes in climate mean and variance across levels of biological organization.
SEV Core Site Bee Monitoring
Objective:
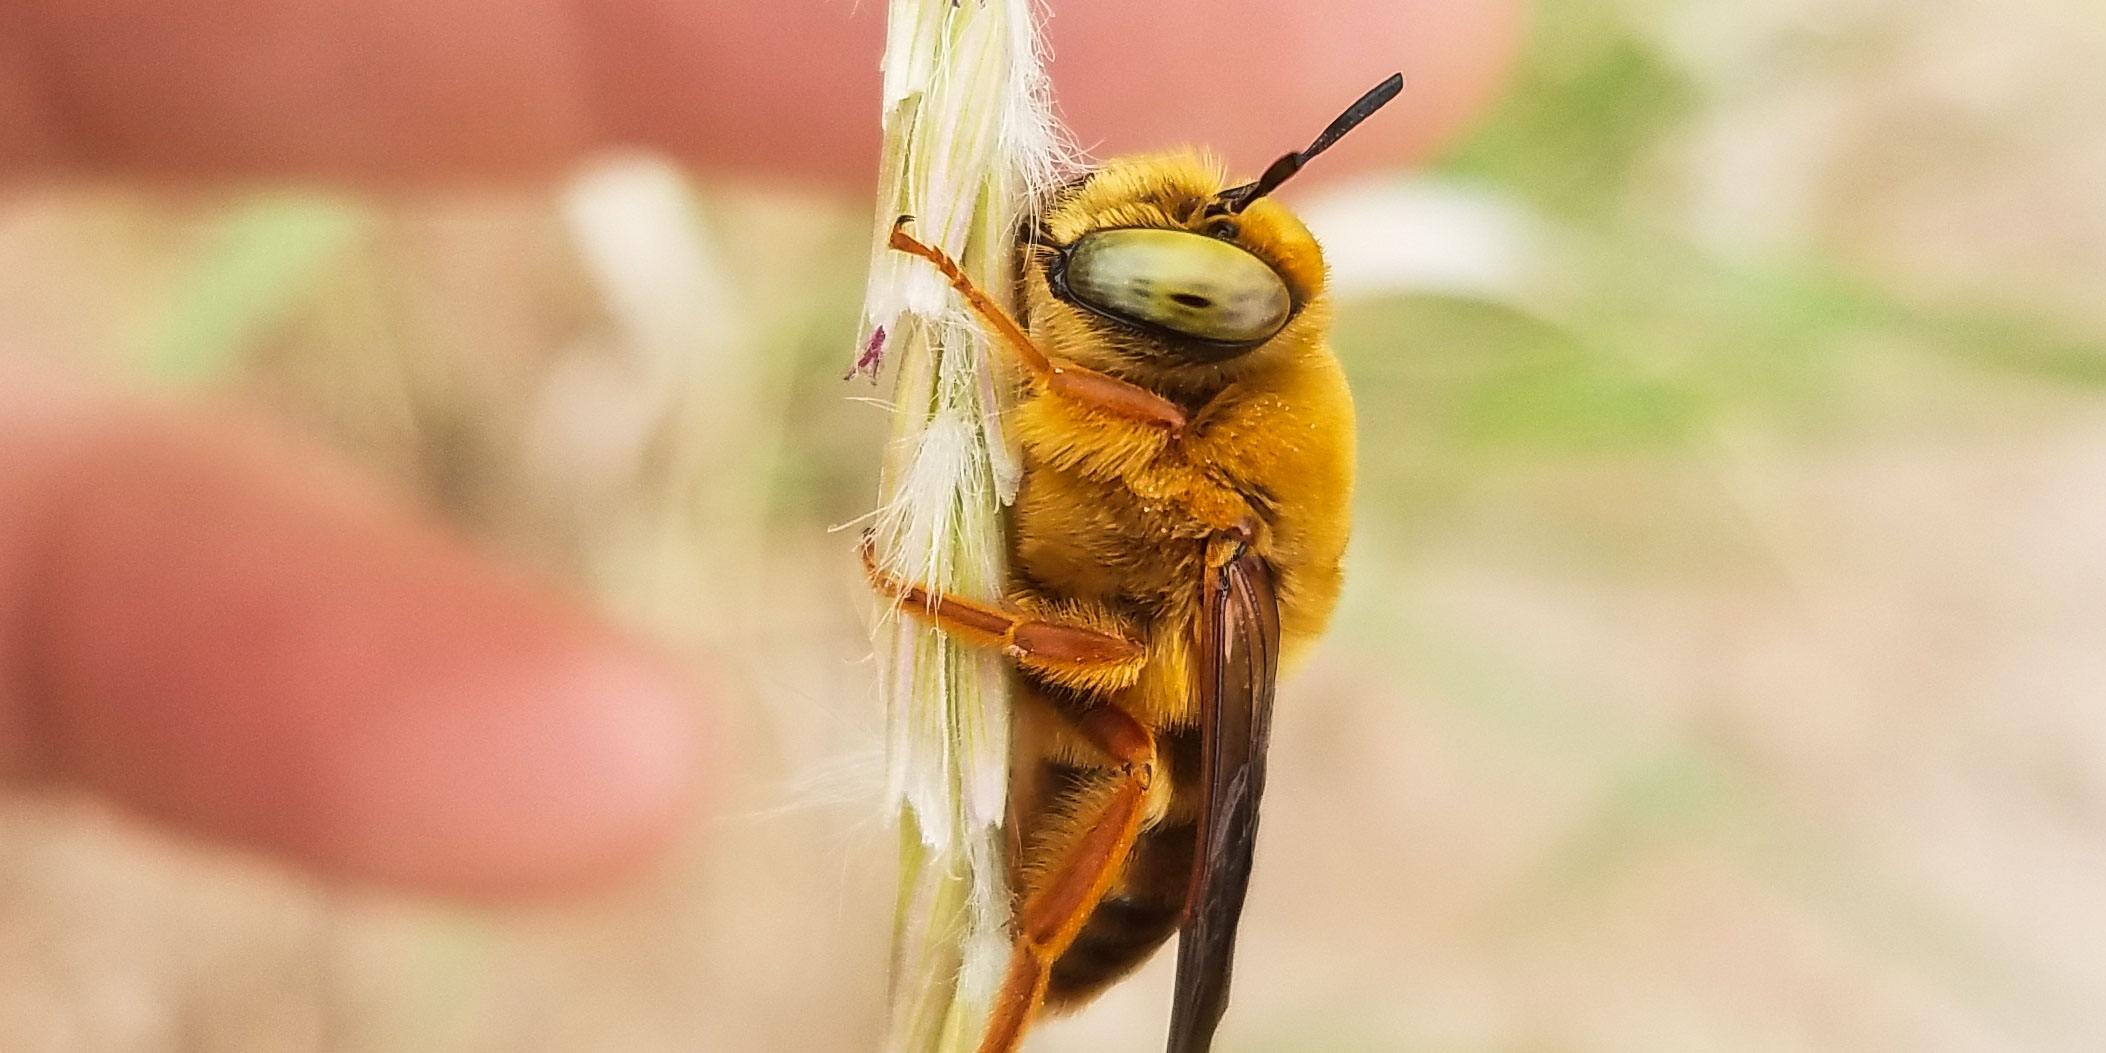
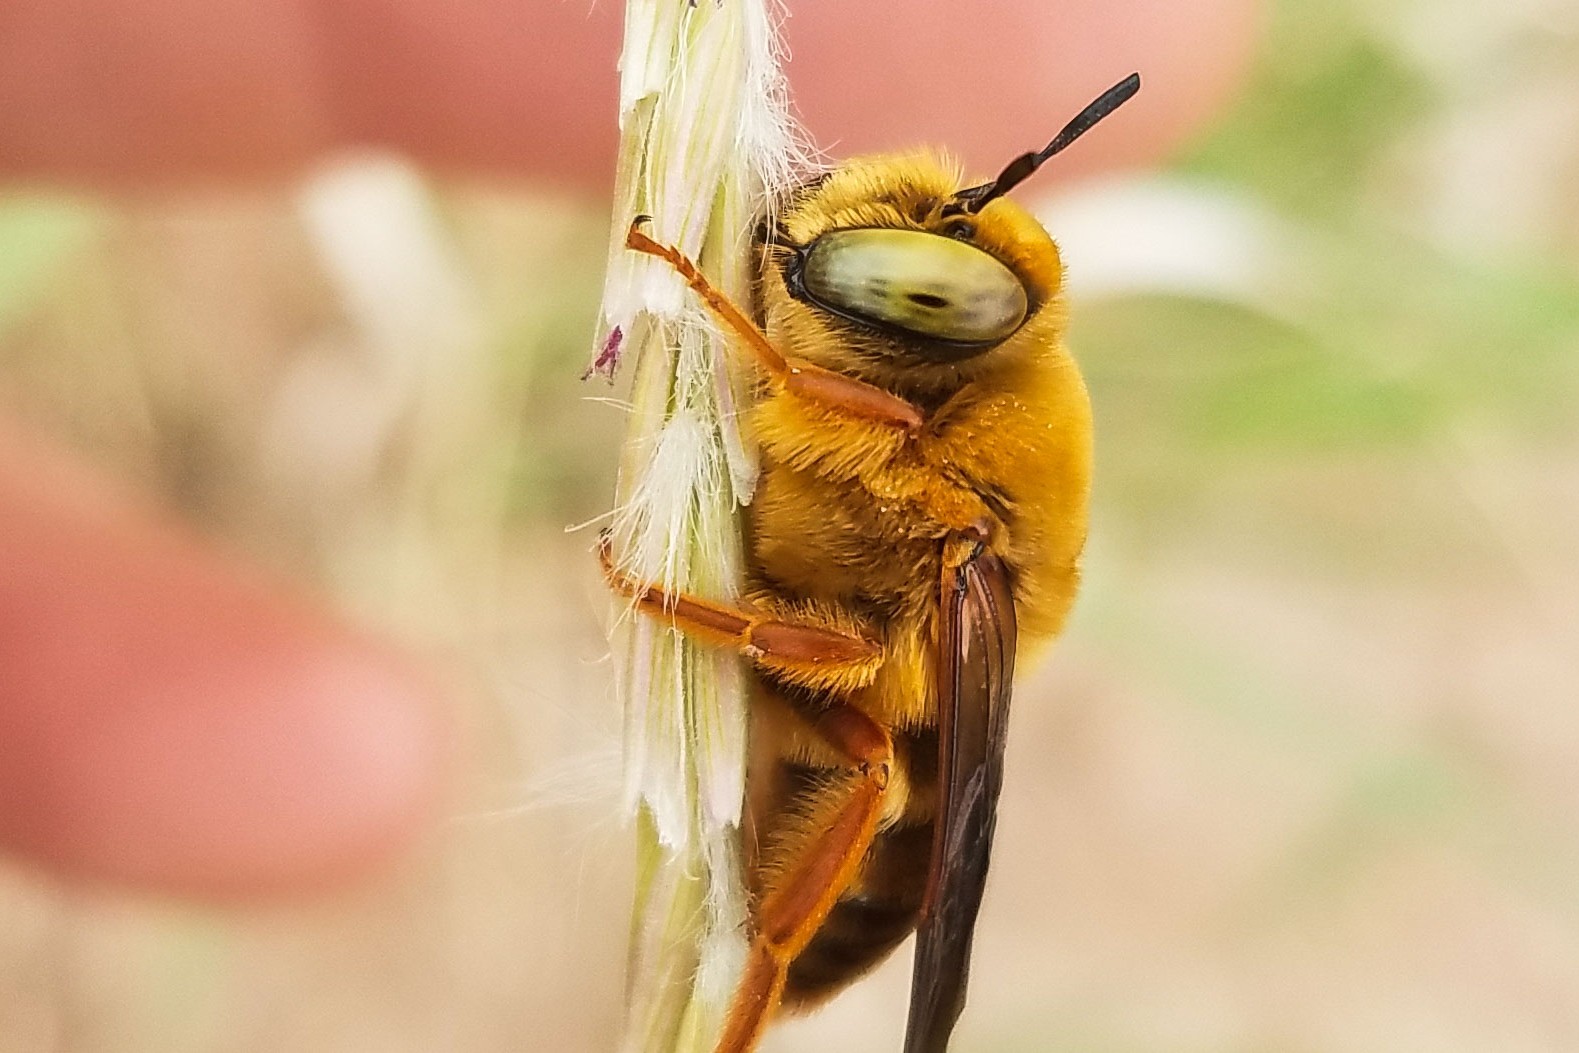
Native bees are crucial members of functional ecosystems, providing the ecosystem service of pollination to a majority of flowering plant species. The southwestern USA is a hotspot of bee biodiversity, with an estimated 1,000 species of native bees present in New Mexico alone. We track variation in dryland bee populations over time to understand drivers of bee declines and monitor changes in pollination services under increasing environmental variability.
Novelty:
Our study is, to our knowledge, the world’s longest continuous bee monitoring effort to date. We have already detected long-term change in bee community composition.
Design:
We monitor bees in three core ecosystem types: Chihuahuan Desert grassland, dominated by black grama grass; Plains grassland, dominated by blue grama grass; and Chihuahuan Desert shrubland, dominated by the bee-pollinated shrub, creosotebush. Bees are collected using passive funnel traps (yellow and blue) that are opened continuously for two weeks each month from March through October. One trap is located at each end of five 200 m transects per site, with one blue and one yellow funnel per transect (total across the three sites: N = 30 traps, with 15 traps/color). This design allows examination of bee population and community patterns across ecosystems, months, and years.
Responses:
Our study design yields abundance data in the form of individual bee species counts for each month and ecosystem. Data have been collected continuously since 2002, and to date include records of >325 bee species representing 56 genera. Bee specimens are processed and archived in the Museum of Southwestern Biology: Division of Arthropods, and identified to the species level. Dr. Karen Wright (Associate Curator, Texas A&M University Insect Collections) initiated this dataset and continues to identify the collected bees. Bee abundance data can be paired with ‘Core monitoring data: Plant phenology’ to examine spatial and temporal concordance in bee and plant communities.
Supporting Documents:
Bee species abundance and composition in three ecosystem types at the Sevilleta National Wildlife Refuge, New Mexico, USA. https://portal.edirepository.org/nis/mapbrowse?scope=knb-lter-sev&identifier=321
SEV Core Site Biogeochemical and Biophysical Monitoring
Objective:
We monitor soil carbon, nitrogen, phosphorus, other nutrients, and microtopography to link these aspects of soil structure and biogeochemistry with climate; disturbances, such as fires; ecological interactions; and major ecosystem state transitions, such as grassland to shrubland. Nitrogen (N) can limit plant productivity in drylands. Microtopography influences the rates of infiltration and run-off following rains. Soil carbon (C) data are essential to improved understanding of the global carbon cycle, particularly in drylands which contribute most to interannual variation in global land surface CO2 flux.
Novelty:
Assessments of terrestrial biogeochemistry are critical components of LTER monitoring across the network. Drylands contain a third of the organic carbon stored in global soils; however, the long-term dynamics of soil organic carbon and soil organic matter (SOM) in drylands remain poorly understood relative to dynamics of the vegetation carbon pool. Our data have uncovered novel patterns. Our soil N data revealed the dependence of nutrient limitation on climate. Soil N levels were greatest following a drought period in 1989, declined during wetter periods that followed, and remained relatively stable until another extended drought period. After a drought in 1995-6, both forms of soil N increased, indicating the potential for a pulse of increased plant productivity following drought that subsides during periods of normal precipitation. Our SOM data linked soil C accumulation with periods of severe drought, and revealed that soil C declined nonlinearly with precipitation. Declines in SOM during wet periods are likely caused by increased soil respiration, runoff, leaching, and soil erosion. In addition, SOM concentration decreased 14% following prescribed fire, a response that magnified over time and persisted for nearly a decade due to the slow recovery of vegetation. Short-term spatial sampling campaigns revealed key differences among ecosystem types: in grasslands, all elements were uniformly distributed, but in shrublands, plant-essential elements, nitrogen, phosphorus, and potassium, were concentrated under shrub canopies, whereas non-limiting elements were either concentrated in the intershrub spaces or were equally across the surface. These results revealed how state transitions from grassland to shrubland contribute to long-term, widespread changes in the structure and function of dryland ecosystems.
Design:
We have monitored soil biogeochemistry in short-term snapshots in several ecosystems types. The longest time series occurred in two grassland locations (1989 – 2014). Soil sample cores (4 cm diameter by 20 cm long) were taken from under vegetation cover or from non-vegetative soil surfaces (open), then composited to give a single soil sample from each sampling location for analysis of soil C and N. In addition, we maintain soil bridges that measure small changes in soil microtopography, erosion and deposition.
Responses:
We have monitored soil C (loss-on-ignition, delta 13C), N (available N and potentially mineralizable N), P (Kjeldahl digestion with copper sulfate), texture (percentage of sand, silt, and clay) and microtopography in space and time with several SEV LTER monitoring campaigns. We also maintain a long-term archive of ground, dried plant leaves for chemical analysis (Moore and Baker 2016).
Supporting Documents:
Long-term dynamics of soil organic matter and aboveground net primary production in a Chihuahuan Desert Grassland at the Sevilleta National Wildlife Refuge, New Mexico (1989-2014). https://portal.edirepository.org/nis/mapbrowse?scope=knb-lter-sev&identifier=326
Sevilleta LTER Vegetation Sample Catalog- Ground Samples for Chemical Analysis. https://portal.edirepository.org/nis/mapbrowse?scope=knb-lter-sev&identifier=294
Soil Surface Dynamics in the Chihuahuan Desert at the Sevilleta National Wildlife Refuge, New Mexico (1994-2013). https://portal.edirepository.org/nis/mapbrowse?scope=knb-lter-sev&identifier=65
Post-fire SOC and delta-13C at different types of microsite at a grassland-shrubland ecotone. https://portal.edirepository.org/nis/mapbrowse?scope=knb-lter-sev&identifier=314
Precipitation Chemistry Data For the Sevilleta National Wildlife Refuge, New Mexico (1989-present). https://portal.edirepository.org/nis/mapbrowse?scope=knb-lter-sev&identifier=2
Soil Nutrient Distributions in Chihuahuan Desert Grasslands and Shrublands at the Sevilleta National Wildlife Refuge, New Mexico (1989). https://portal.edirepository.org/nis/mapbrowse?scope=knb-lter-sev&identifier=152
Soil Characteristics Following a Lightning-Initiated Fire at MacKenzie Flats, Sevilleta National Wildlife Refuge, New Mexico (1998). https://portal.edirepository.org/nis/mapbrowse?scope=knb-lter-sev&identifier=170
SEV Evolutionary Monitoring
Objective:
The LTER network has untapped opportunities to monitor evolutionary response to environmental change. We follow population traits and their underlying genetic bases every 6 years in natural habitats and also in our Mean-Variance experiment. The ongoing revolution in genetic sequencing technologies means that we are increasingly able to connect phenotypic changes in populations to genetic changes, even in non-model species. Our robust monitoring program couples shifts in species traits (See Plant Trait and Consumer Trait monitoring) with the evolutionary changes that underlie those traits by archiving tissues for future sequencing.
Novelty:
Evolutionary monitoring has rarely occurred at LTER sites, and represents an important enhancement of the LTER mission with high potential for novel insights into eco-evolutionary feedbacks. Our new archive of tissue samples are preserved in tanks of liquid nitrogen at the UNM Museum of Southwestern Biology.
Design:
We archive and investigate the genetic histories of dominant dryland species, using exact GPS coordinates for re-sampling. We sample roots of five foundation plant species (to include their microbiomes), six small mammal species (20% of SEV species), eleven grasshopper species (20%), and soils containing the two dominant species of Microcoleus, the foundational cyanobacteria taxa in biocrusts. For species with dormant storage (e.g. seeds, spores), we adopt the seed banking methods of Project Baseline (Etterson et al. 2016). For microbes in biocrusts and in plant roots, we are generating a long-term record of shifts in microbial composition that track climate. As genes for climate adaptations are identified, we will use archived materials plus extensive museum collections to assess molecular signatures of selection and shifts in allele frequency.


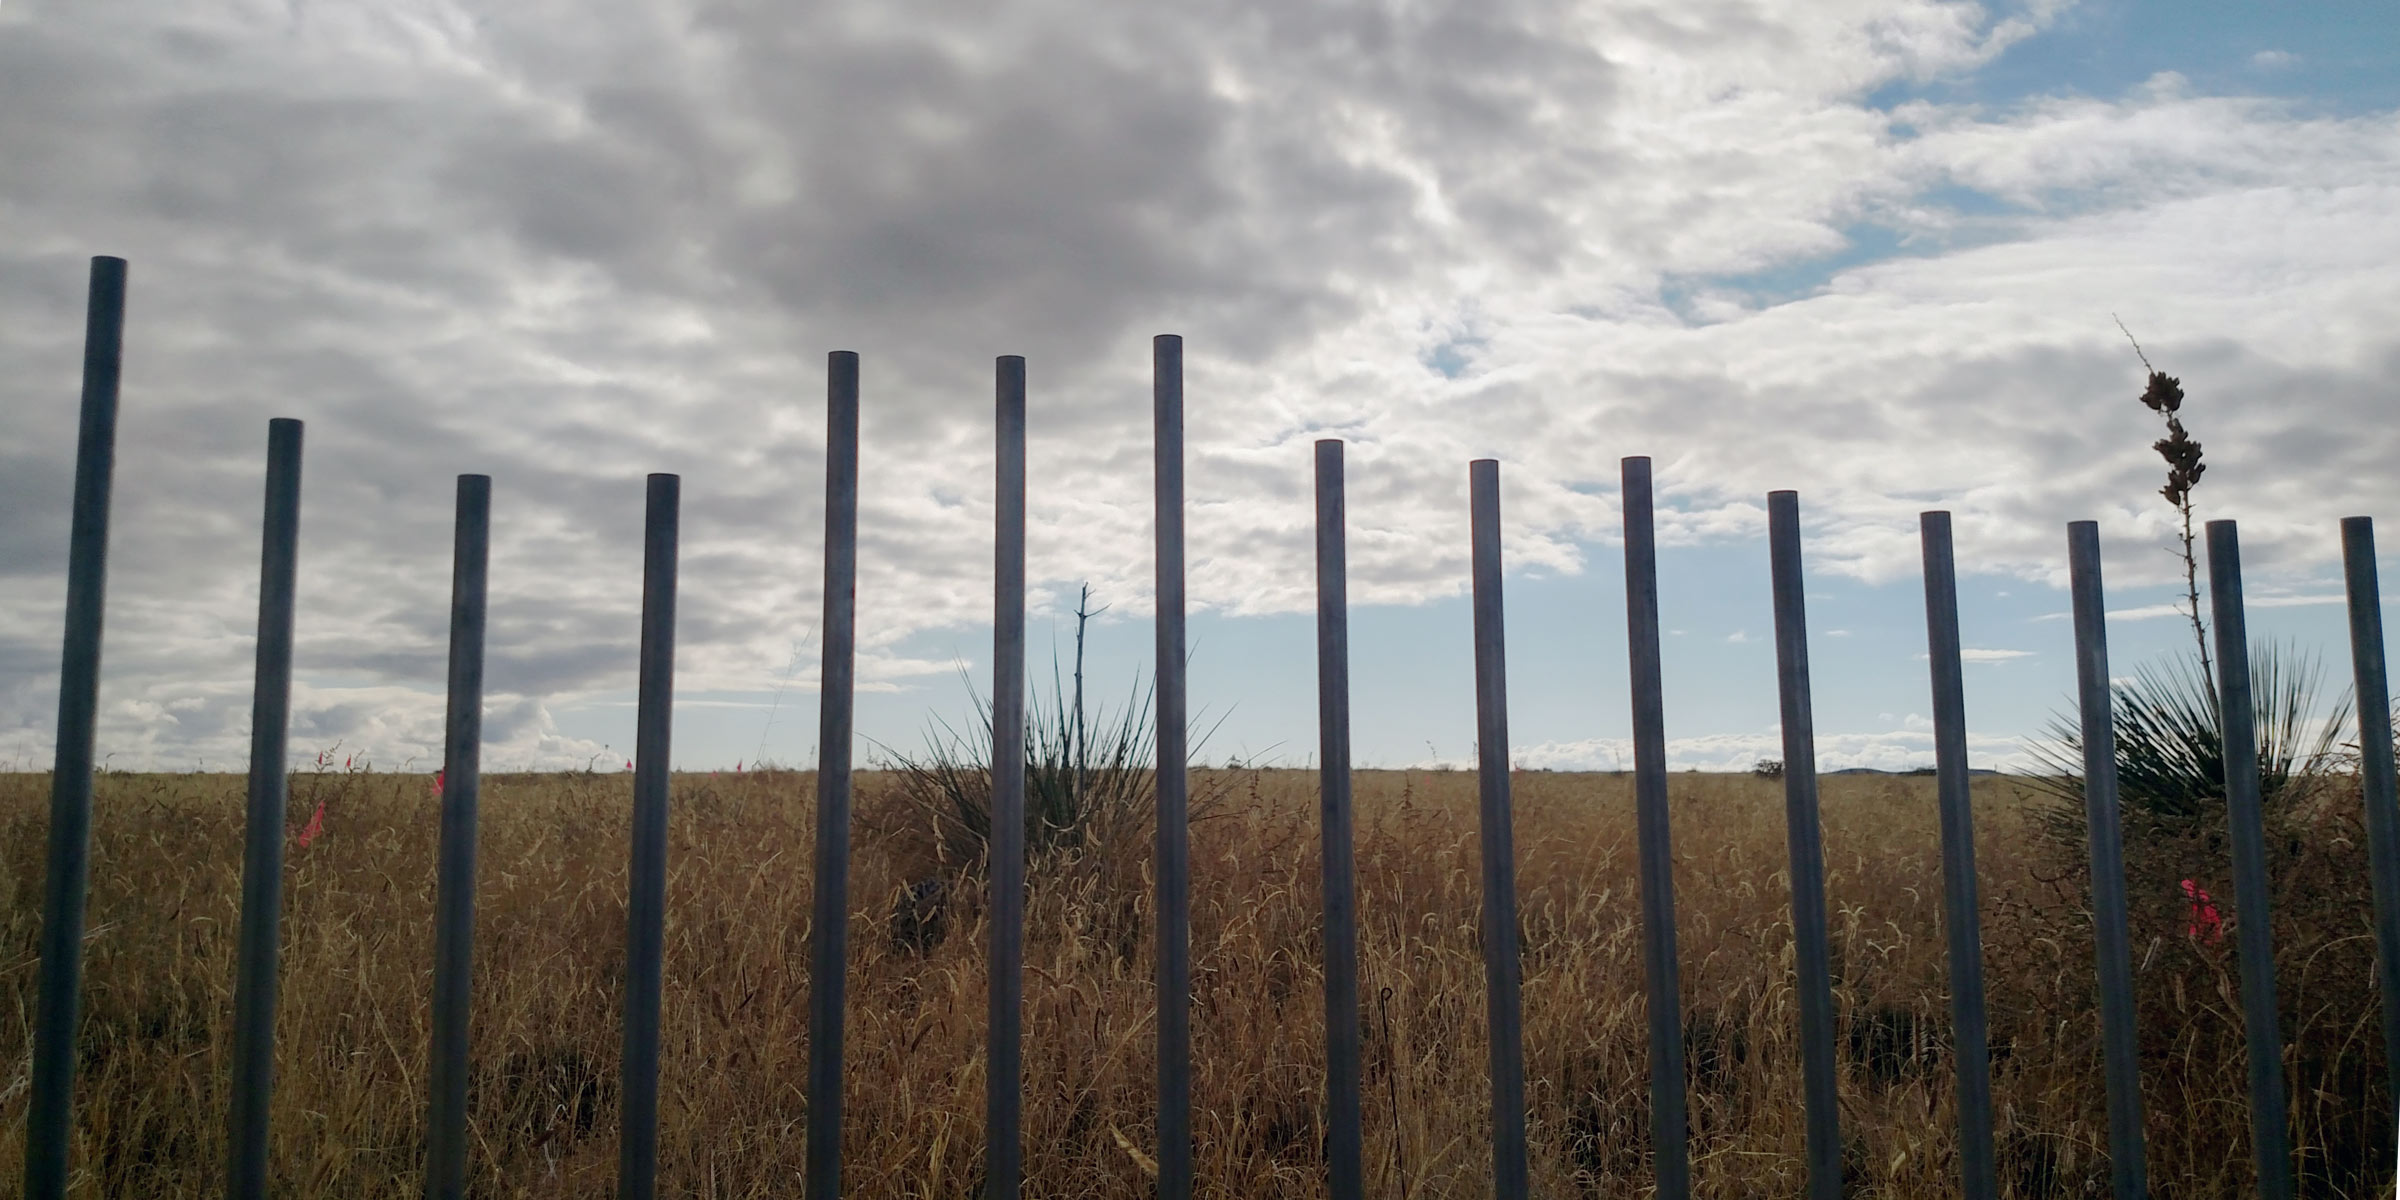
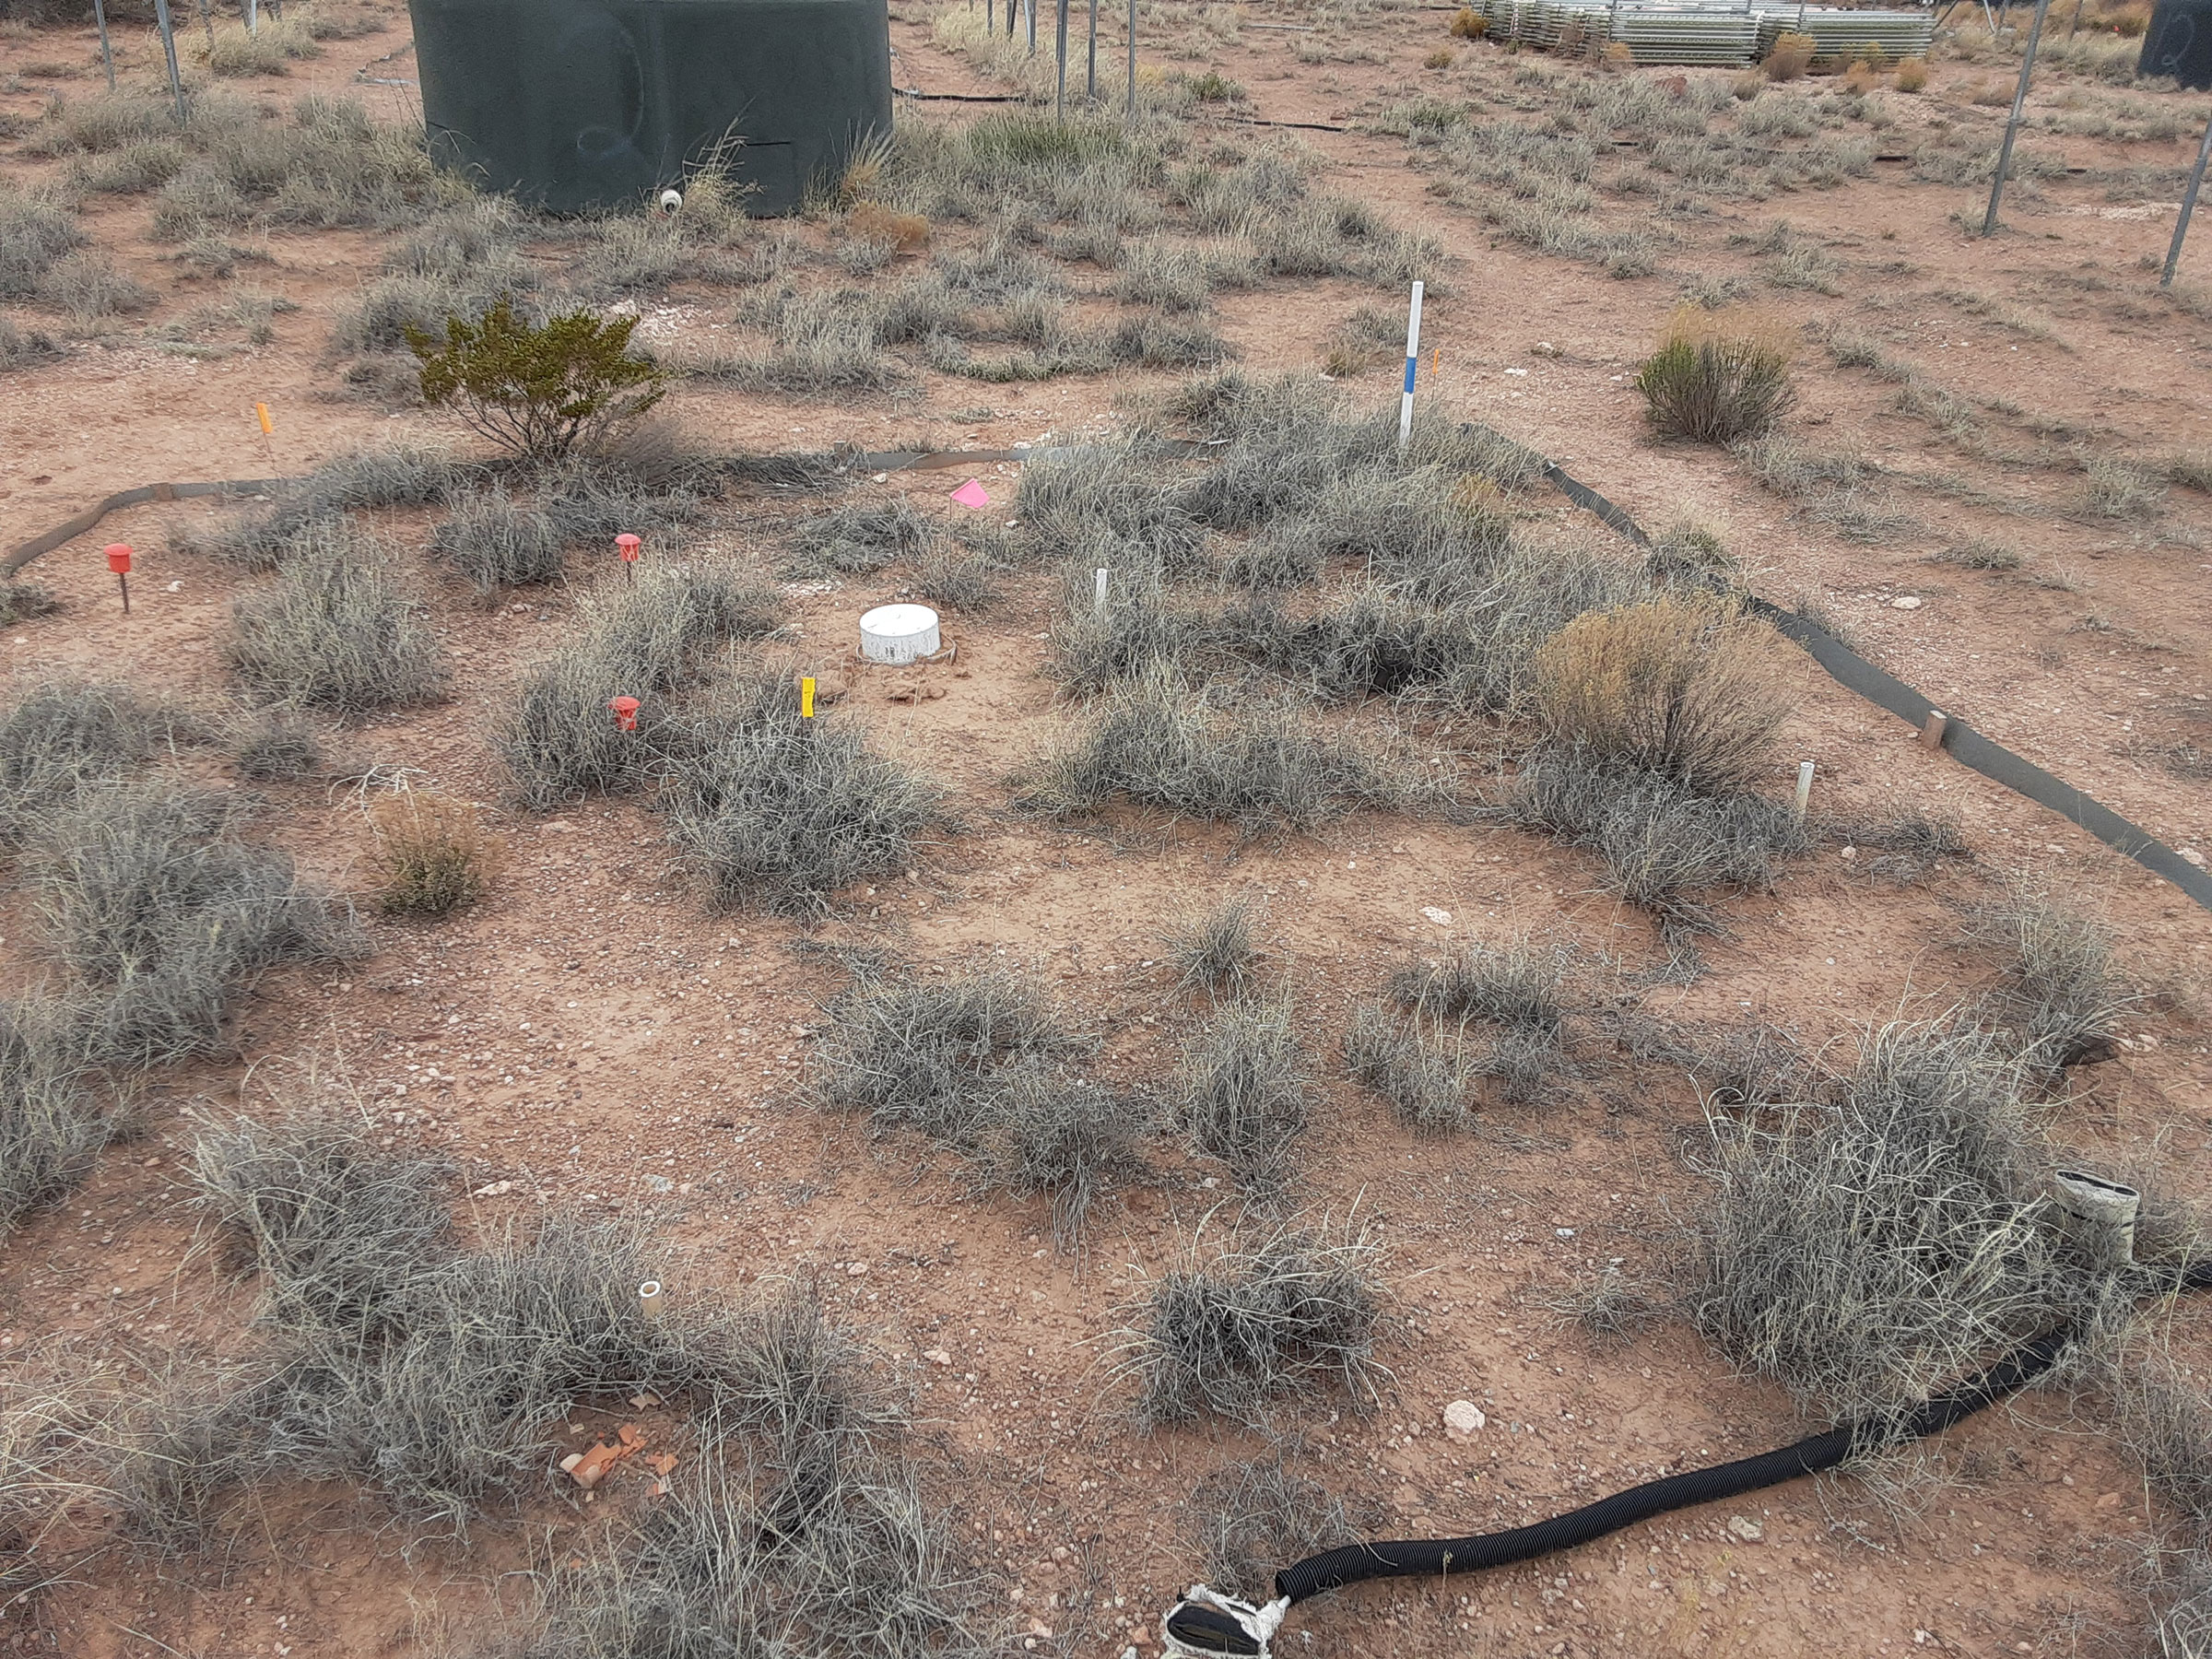
Control versus drought plot types and liquid nitrogen storage.
Responses:
During the first six years, our efforts are primary archival. We preserve tissues for future sequencing work in the UNM Museum of Southwestern Biology, along with rich metadata.
Supporting Documents:
A SEV LTER example of evolution in action in response to climate change:
Whitney KD, Mudge J, Natvig DO, Sundararajan A, Pockman WT, Bell J, Collins SL, Rudgers JA. Experimental drought reduces genetic diversity in the grassland foundation species Bouteloua eriopoda. Oecologia. 2019 Apr;189(4):1107-1120. https://doi.org/10.1007/s00442-019-04371-7
Etterson JR, Franks SJ, Mazer SJ, Shaw RG, Gorden NL, Schneider HE, Weber JJ, Winkler KJ, Weis AE. Project Baseline: An unprecedented resource to study plant evolution across space and time. Am J Bot. 2016 Jan;103(1):164-73. https://doi.org/10.3732/ajb.1500313
SEV Core Site Long-Term Grasshopper Community Dynamics
Objective:
We monitor grasshopper (Orthoptera: Acrididae) species composition and abundance in four core ecosystem types: Chihuahuan Desert grassland, Plains grassland, Chihuahuan Desert creosotebush shrubland, and piñon-juniper woodland. Grasshoppers are counted in early summer and in late summer to include seasonal specialist species. Coupled with long-term core site data on plant species composition, aboveground plant biomass, and meteorology, the grasshopper data provide information on relationships between consumers and changes in climate and vegetation.
Novelty:
To our knowledge, this study is unique in the world in providing long-term (>10 years) seasonal data on grasshopper communities from multiple dryland ecosystems at species-level resolution. Our data yield information on the grasshopper species predicted to be winners or losers under climate change and with predicted shifts in plant species composition and ecosystem state transitions.
Design:
Grasshoppers are counted on six 50 m × 1m transects around the perimeters of five 200m diameter rodent trapping webs at each of the LTER core monitoring sites: Chihuahuan Desert grassland (since 1992), Plains grassland (since 2001), Desert creosotebush shrubland (1992), and Piñon-juniper woodland at Goat Draw (1992-2000). The 5 webs per ecosystem site provide independent units of replication within each ecosystem type, and each of 6 transects (50m X 1m) per web are nested subsamples. The Goat Draw site was replaced by the Blue Grama Grassland Site in 2001 when the Sevilleta LTER program made that site change. This study was initiated in 1992, and is ongoing to the present time.
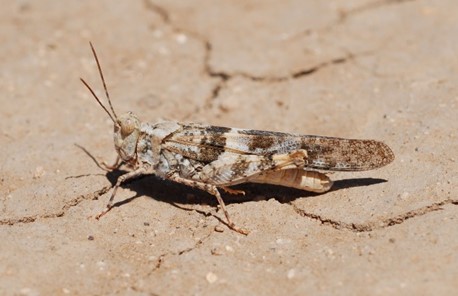
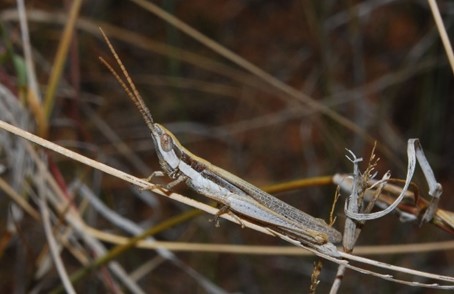
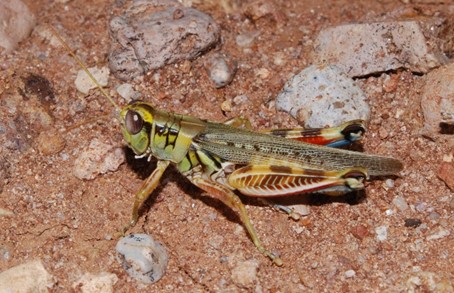
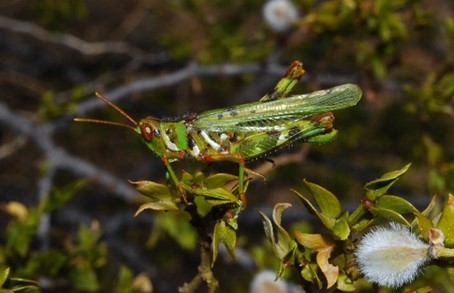
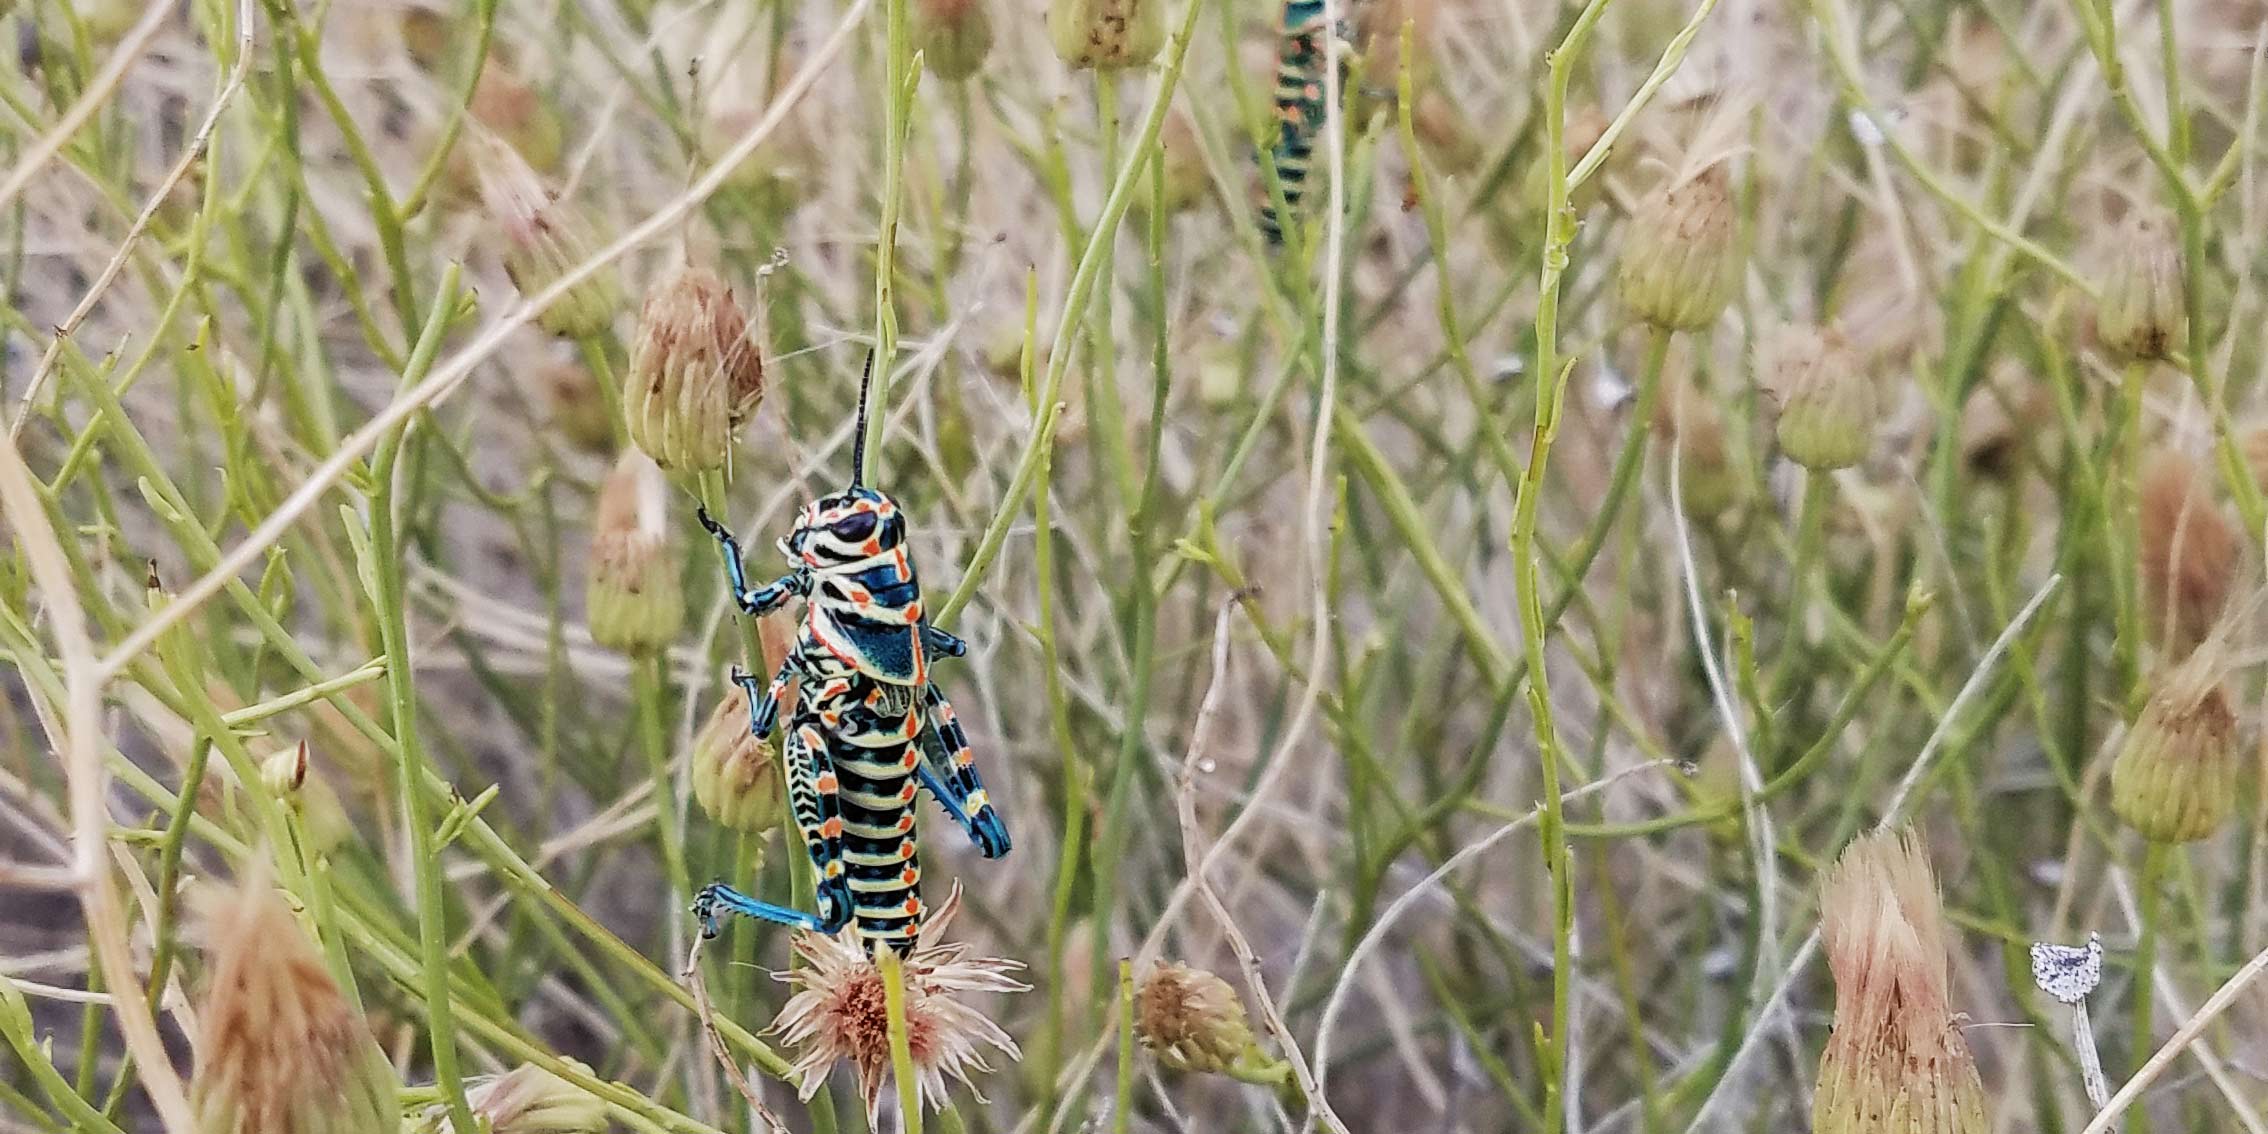
Several grasshopper (Orthoptera: Acrididae) species at the Sevilleta LTER.
Responses:
Data recorded for each individual grasshopper observed per transect: species, sex, age class, and the substrate from which each grasshopper was flushed. Grasshopper count data are collected over a 2-day sampling period, twice each year, during early summer or late summer. Visual counts of all grasshoppers on each 50 square meter strip transect are made by the observer (D.C. Lightfoot, for consistency) who slowly walks each transect, flushing grasshoppers ahead with a one-meter long – 1-inch diameter, white PVC pipe. The observer records data on to a voice-activated micro-cassette recorder, and then transcribes the audio data into digital spreadsheet format.
Supporting Documents:
Long-Term Core Site Grasshopper Dynamics for the Sevilleta National Wildlife Refuge, New Mexico. https://portal.edirepository.org/nis/mapbrowse?scope=knb-lter-sev&identifier=106
SEV Core Site Long-term Plant Species Monitoring
Objective:
We estimate spring and fall season plant species cover and biomass to track the dynamics of populations, communities, and primary production. In subsets of sites, we also estimate belowground plant biomass. These data enable the detection of losses and gains in biodiversity and predictions on the drivers of and responses to changes in plant community composition and productivity over time. In addition, net primary production (NPP) is a fundamental ecosystem variable that quantifies rates of carbon consumption and fixation. Estimates of above- and belowground NPP are important to understanding energy flow at a community level as well as spatial and temporal responses to a range of environmental processes
Novelty:
Many long-term monitoring programs measure changes in vegetation cover or collective aboveground plant biomass; however, the SEV LTER datasets are resolved phylogenetically to plant species and spatially to the scale of individual plants or clonal patches. This finely tuned plant monitoring approach enables detailed studies of the demography of individual plant species as well as robust estimates of plant community diversity, composition, and the relative contributions of plant species to total vegetative biomass. In addition, at some sites data are paired with robust estimates of belowground plant biomass, providing the full picture of total NPP. Our statistical Climate Sensitivity Function approach (see Rudgers et al. 2018, Ecology) provides novel information on the vulnerabilities of plants to future increases in climate variability.
Design:
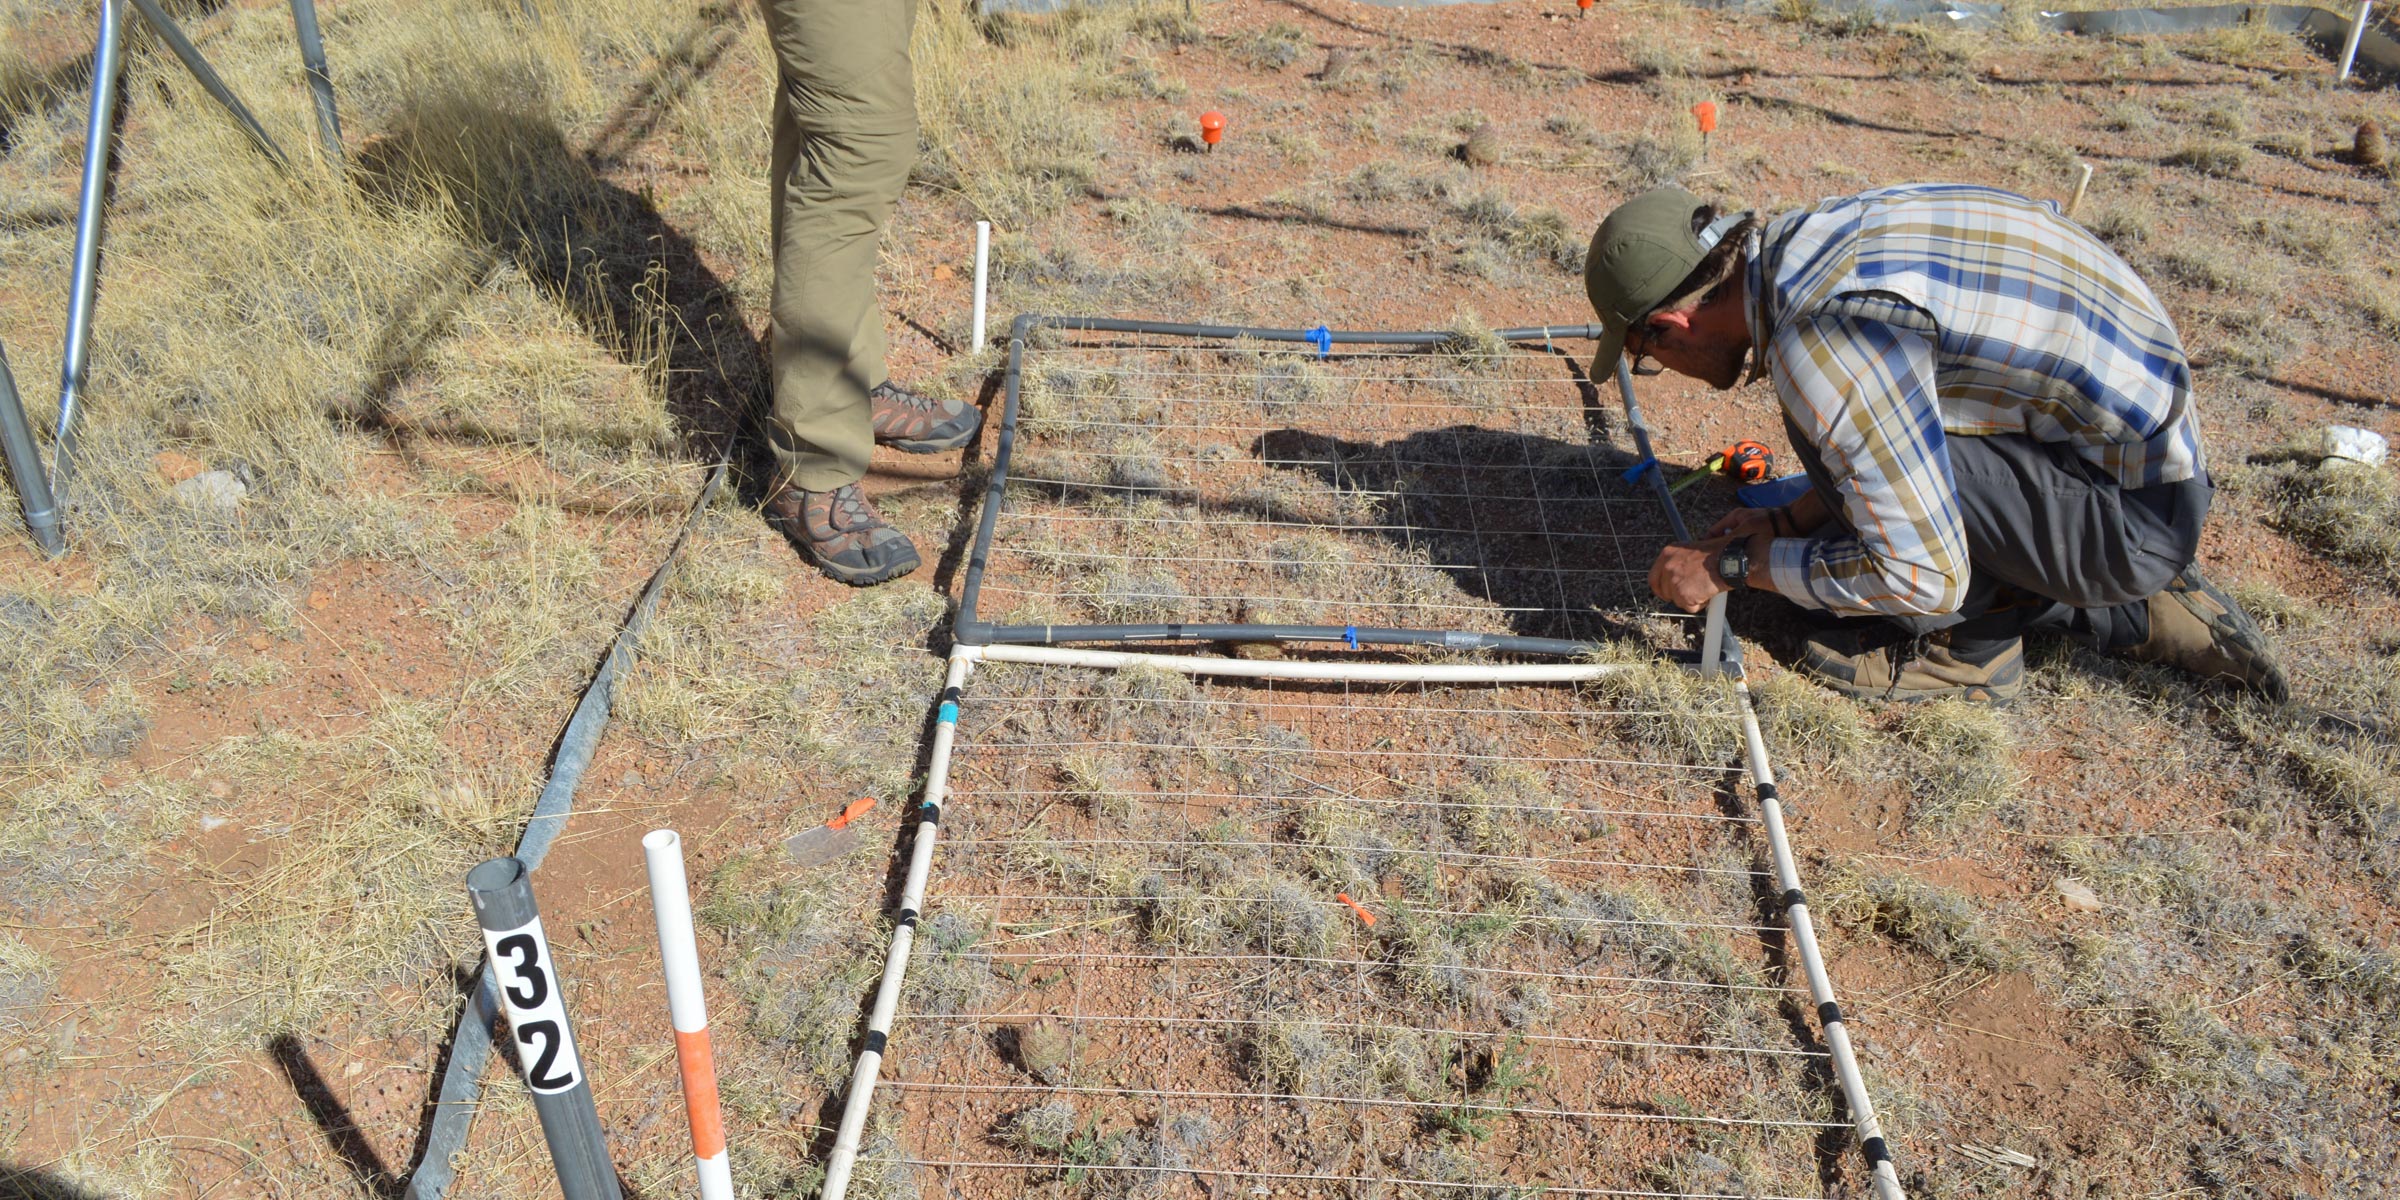
We monitor plants in nearly 1,000 permanently marked quadrats (1m x 1m), along 400-m transects, and belowground in root donuts across representative dryland ecosystems of the SW US. Ecosystems include Chihuahuan Desert and Plains grasslands, Chihuahuan Desert creosotebush shrublands, juniper savanna, piñon‐juniper woodland, and ecotones among them. Monitoring includes subsets of quadrats that have experienced historical burns from prescribed or natural wildfires. Quadrats have been monitored since 2002 (Plains grassland) or 1999 (all others). Line-intercept transects have been surveyed since 1989 and span one burned period. Root biomass estimates occur for a subset of sites. There are 690 plant species monitored across all SEV LTER sites on the Sevilleta National Wildlife Refuge.
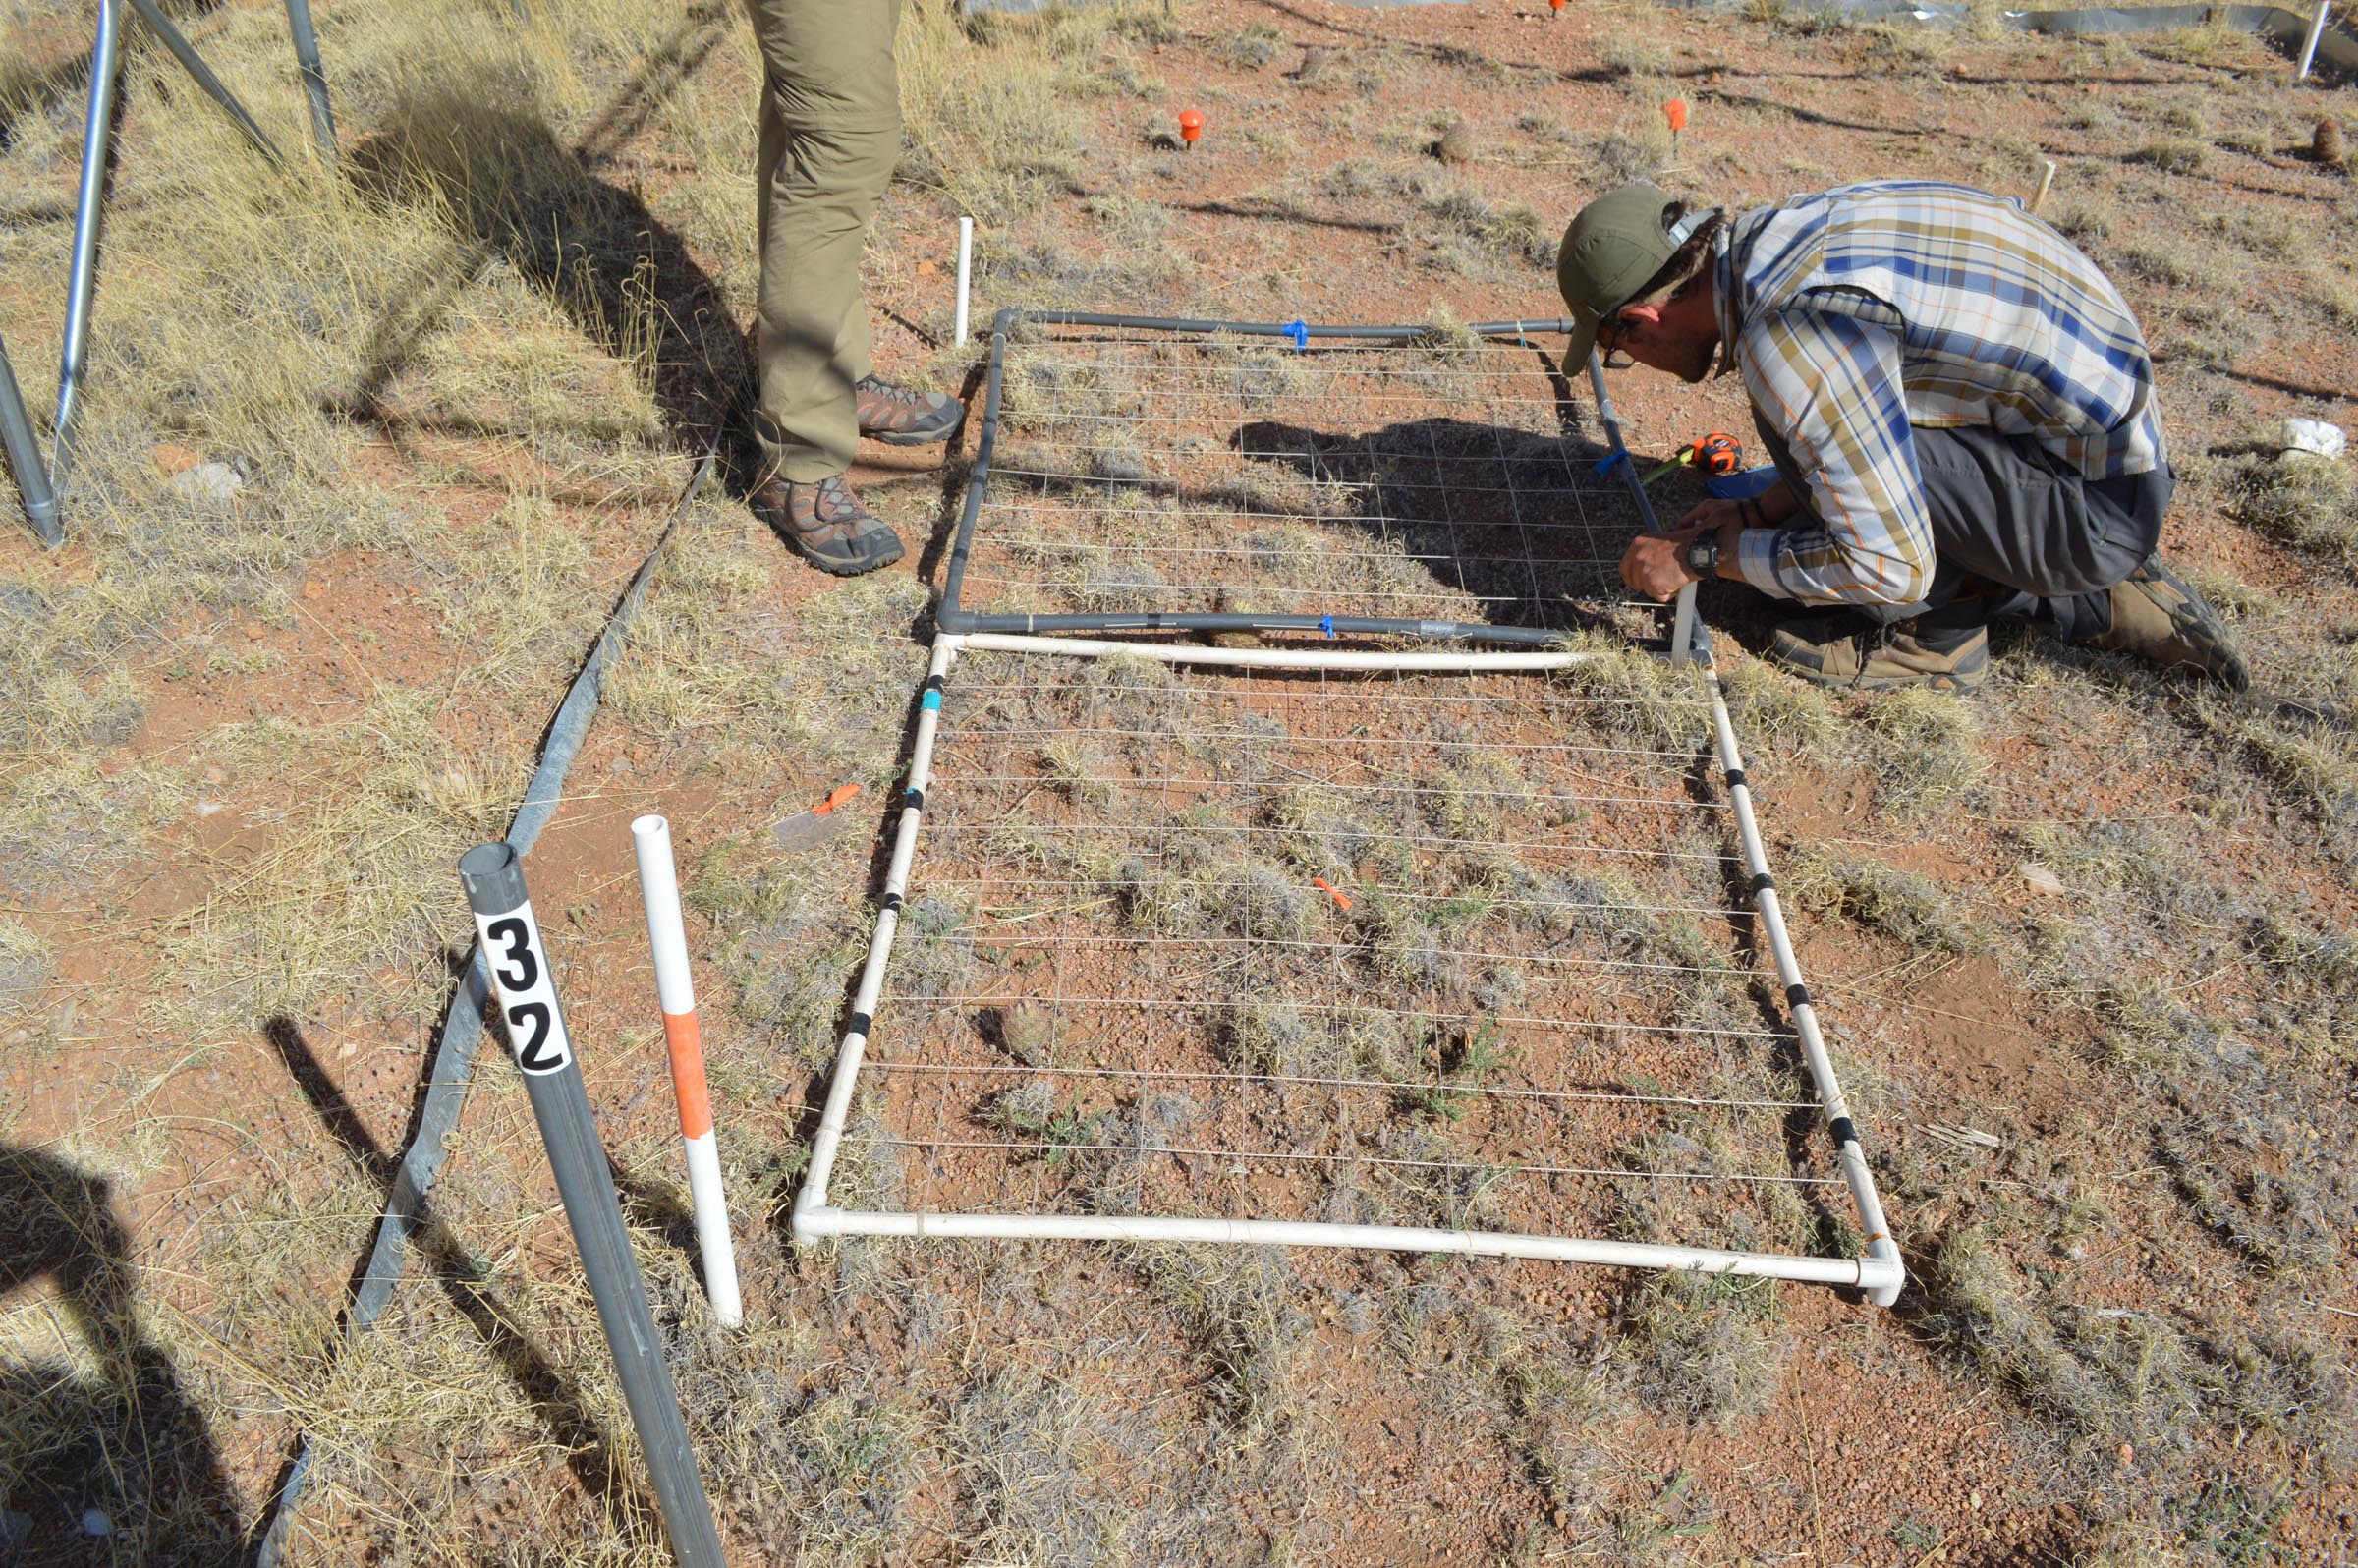
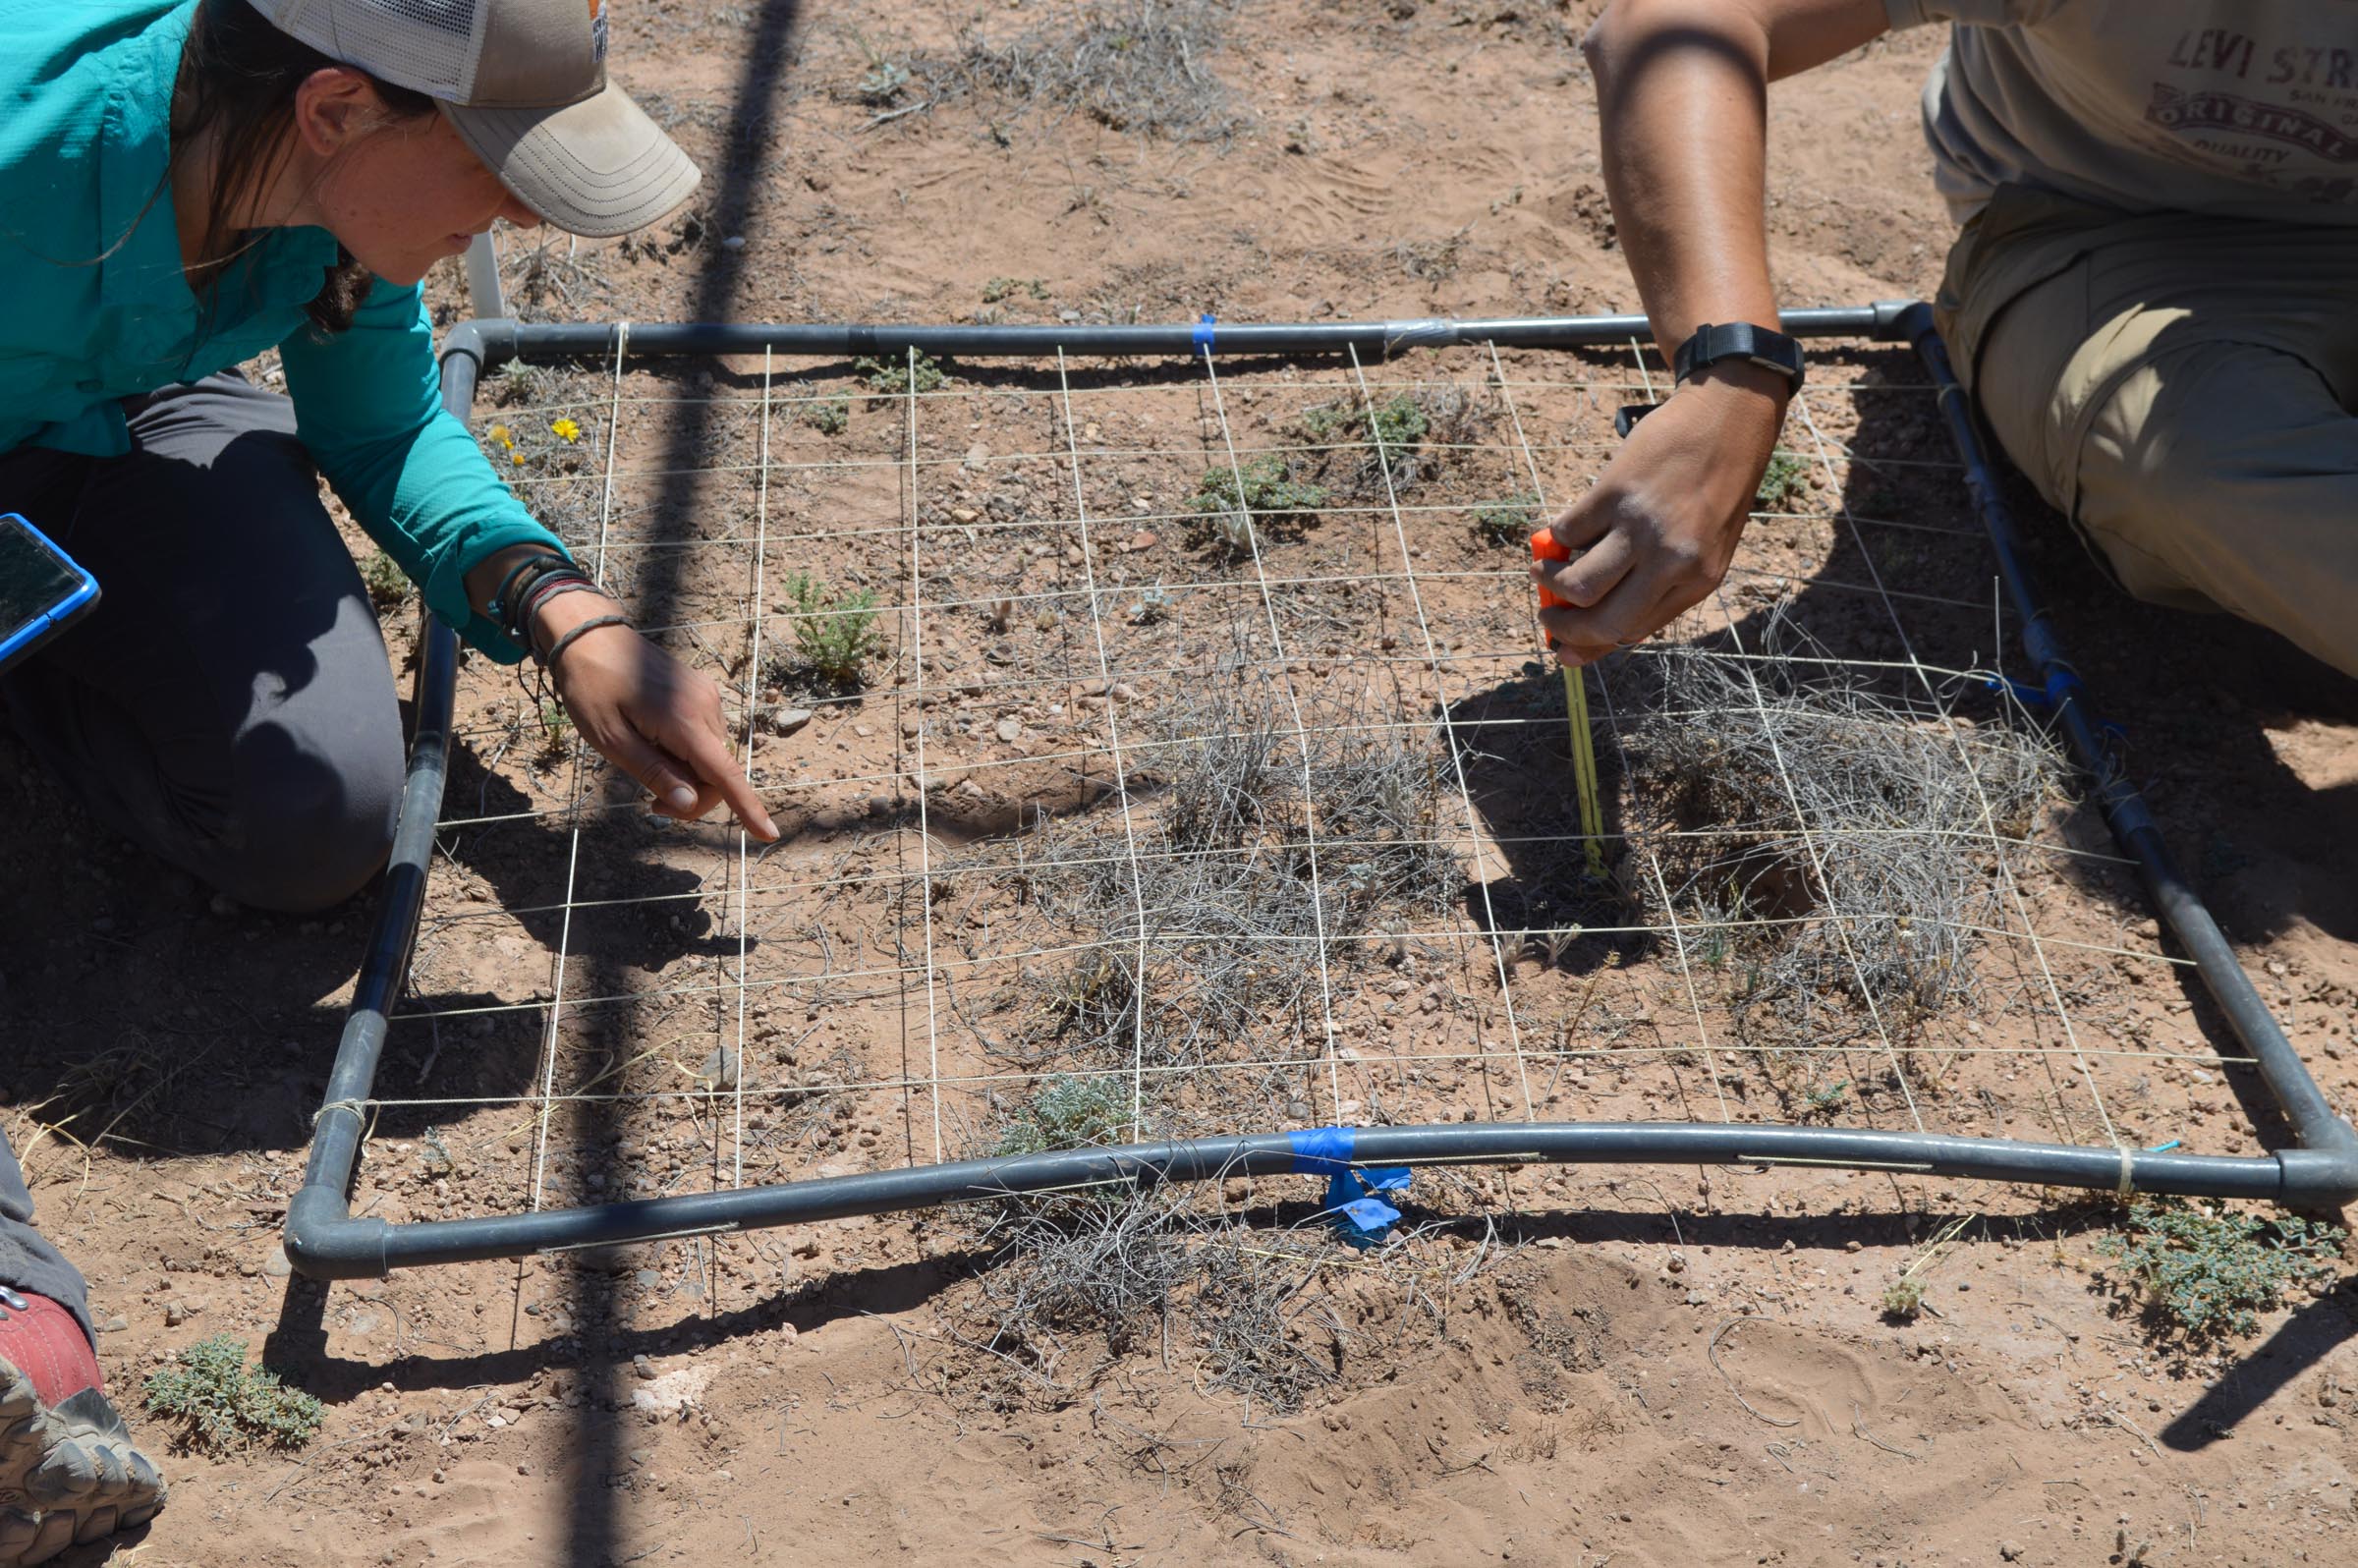
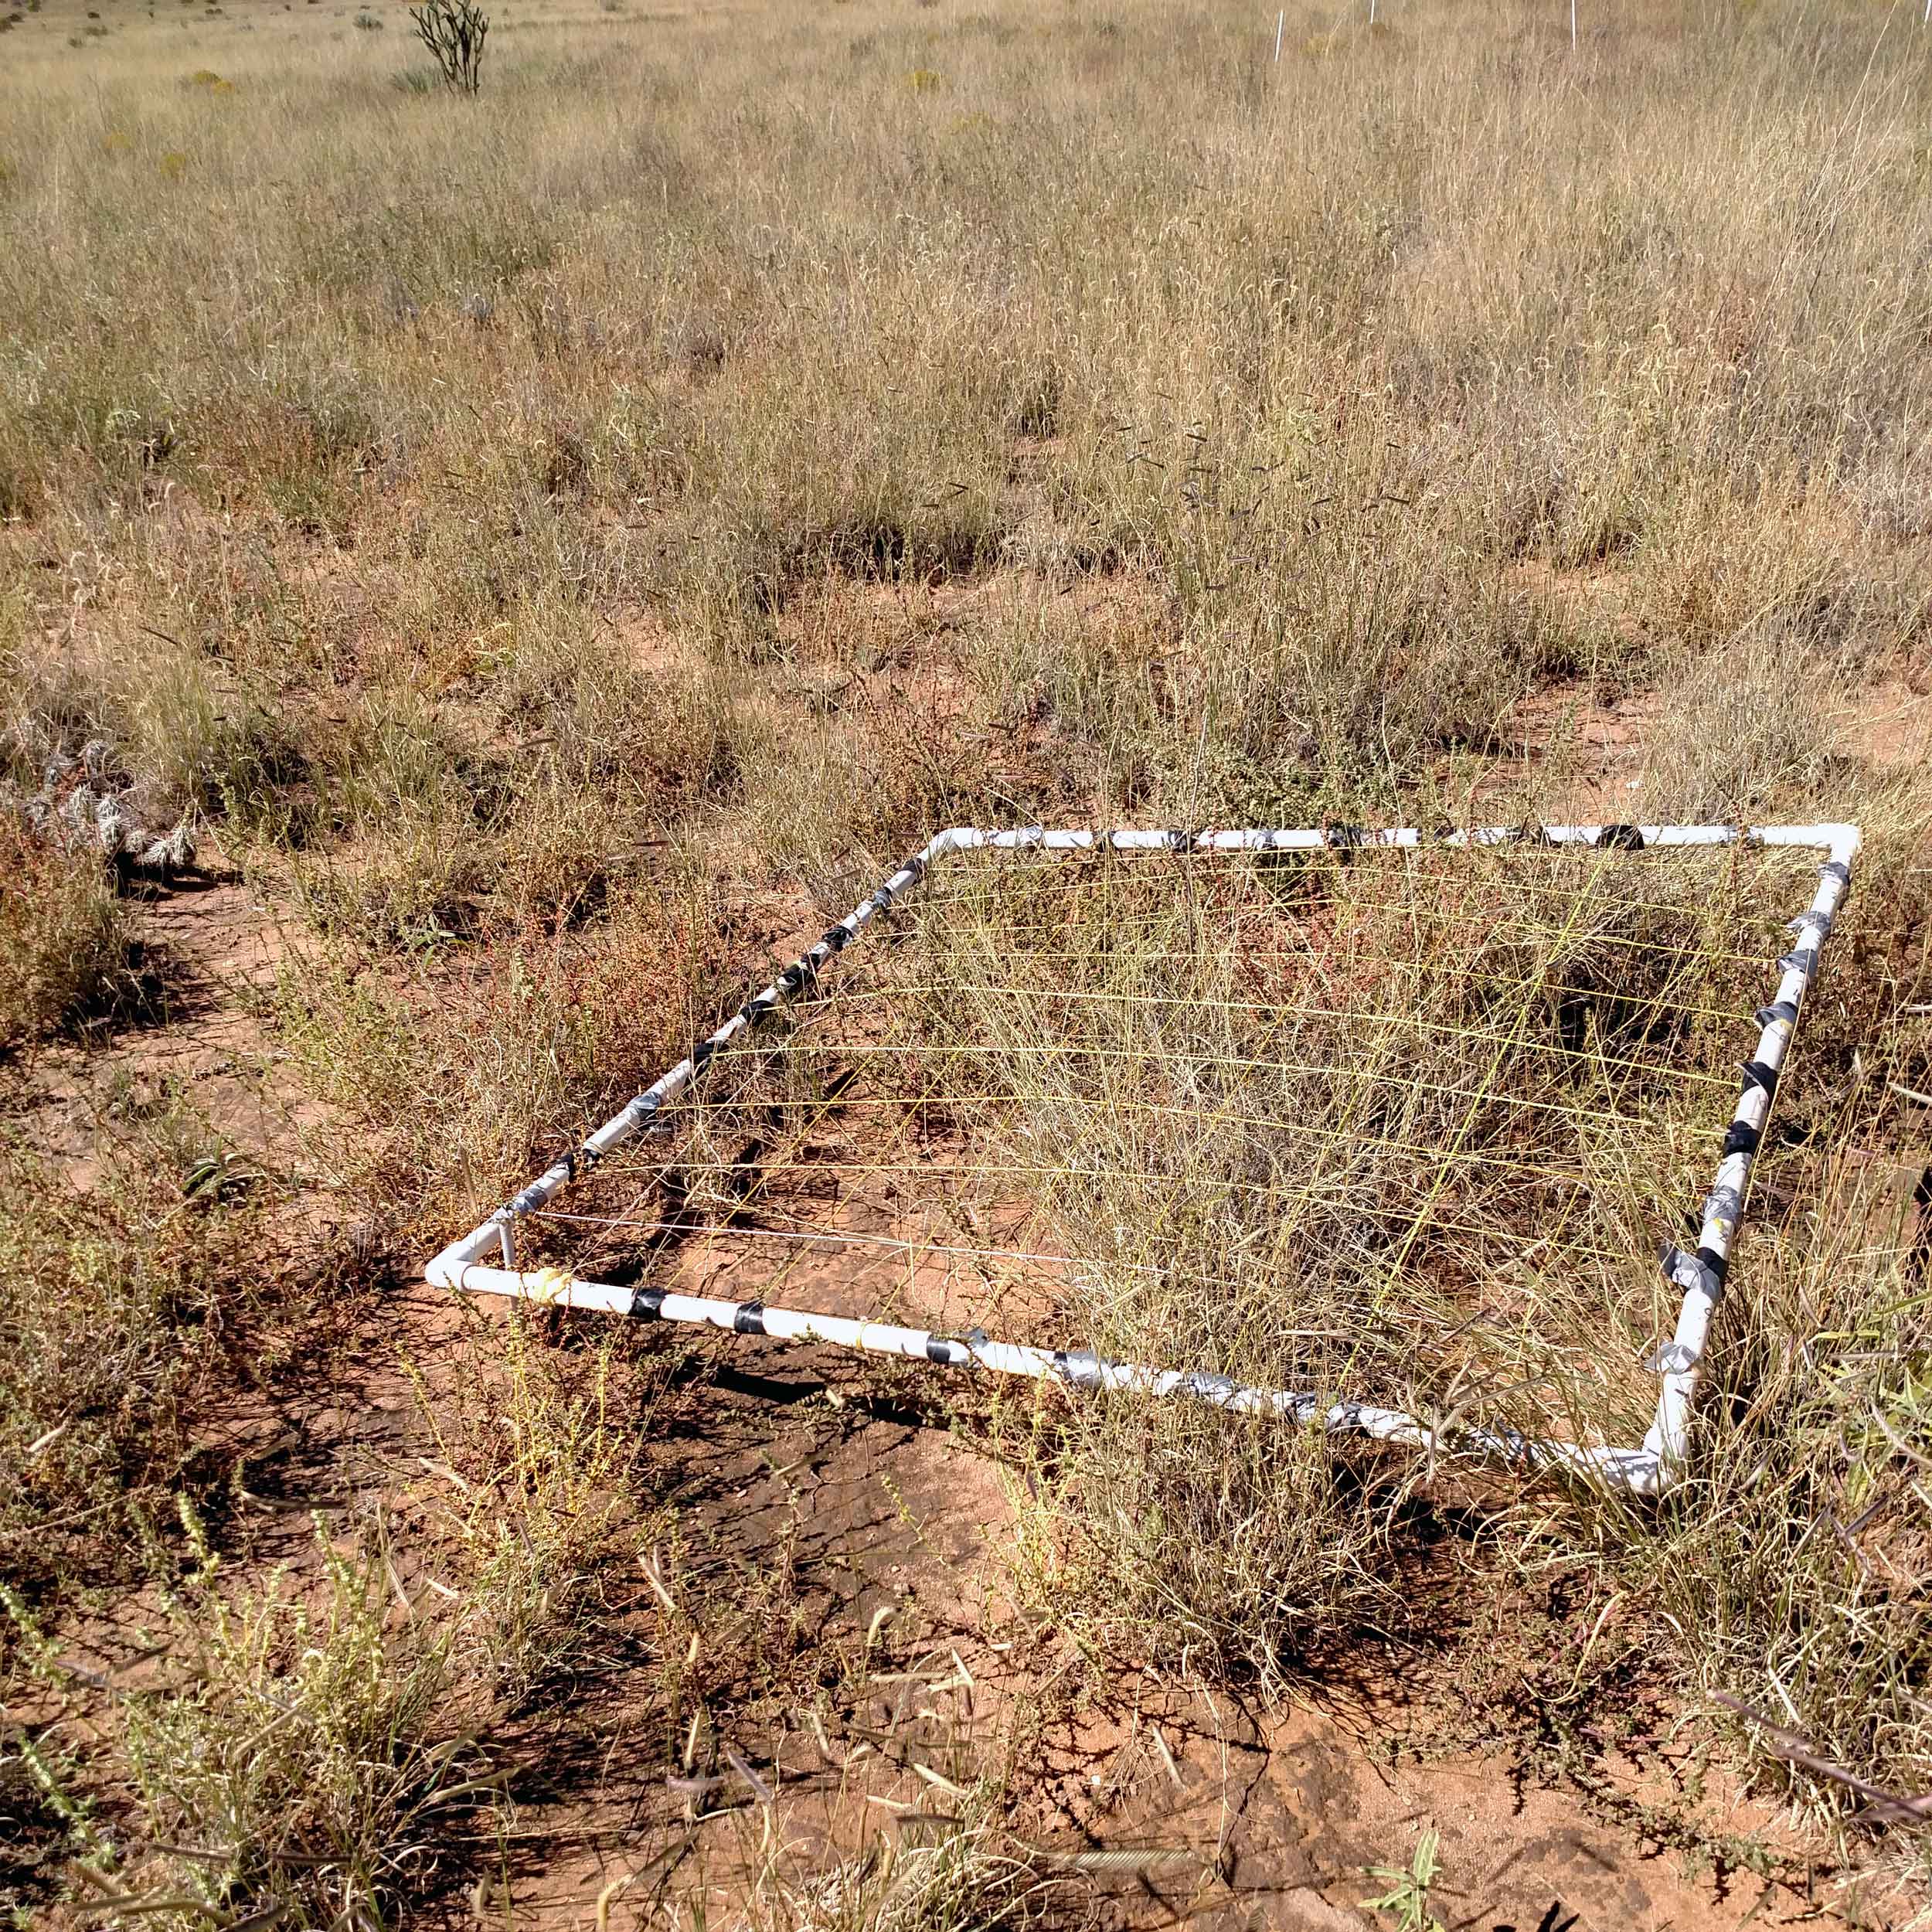
Quadrats in use to collect plant species cover and height.
Responses:
Spring measurements occur in April or May when shrubs and spring annuals have reached peak biomass. Fall measurements occur in September or October when summer annuals have reached peak biomass, but prior to killing frosts. Winter measurements in quadrats were taken in February before the onset of spring growth, but winter sampling periods ended in 2007.
In quadrats, plant species cover and height data are collected by placing a 1m x 1m PVC-frame over stakes that mark the diagonal corners of each quadrat. Each PVC-frame is divided into 100 squares, marked off with nylon string. The dimensions of each square are 10cm x 10cm, and each square represents 1 percent of the total area. The cover (area) and height of each individual live (green) vegetative unit that falls within the 1m x 1m quadrat is measured. A vegetative unit consists of an individual size class (as defined by a unique cover and height) of a particular species within a quadrat. Cover is quantified by counting the fractional number of 10cm x 10cm squares filled by each vegetative unit.
Along transects, line-intercept data are collected by unrolling a 100m measuring tape and affixing it to permanent pieces of rebar hammered into the ground at each of the four segments of a 400 m transect. Each species or substrate (i.e., bare soil, litter) that intersects the tape and occupies at least one centimeter is recorded whether rooted beneath the tape or not. Observations are recorded at the cm level, the point at which the species or substrate first crosses the tape being stated. This starting location is noted but the ending point is considered to be the starting point of the next species or substrate.
For root biomass, roots and soil are harvested annually in late fall after the growing season, and structures are reestablished in situ for consecutive harvests each year. Each structure allows roots to be harvested at two depths (0-15 and 15-30 cm) to estimate root production, or below ground net primary productivity.
SEV Plant species list:
Sevilleta Long-Term Ecological Research Program Plant Species List. https://portal.edirepository.org/nis/mapbrowse?scope=knb-lter-sev&identifier=318
Climate sensitivity function approach:
Maurer, G. E., A. J. Hallmark, R. F. Brown, O. E. Sala, and S. L. Collins. 2020. Sensitivity of primary production to precipitation across the United States. Ecology Letters 23:527–536. https://doi.org/10.1111/ele.13455
Rudgers, J.A., Chung, Y.A., Maurer, G.E., Moore, D.I., Muldavin, E.H., Litvak, M.E. and Collins, S.L. (2018), Climate sensitivity functions and net primary production: A framework for incorporating climate mean and variability. Ecology, 99: 576-582. https://doi.org/10.1002/ecy.2136
Quadrat data:
Burn Study Sites Quadrat Data for the Net Primary Production Study at the Sevilleta National Wildlife Refuge, New Mexico. https://portal.edirepository.org/nis/mapbrowse?scope=knb-lter-sev&identifier=156
Line intercept:
Grassland Vegetation Line-Intercept Transects at the Sevilleta National Wildlife Refuge, New Mexico. https://portal.edirepository.org/nis/mapbrowse?scope=knb-lter-sev&identifier=4
Discontinued Vegetation Line-Intercept Transects in Transition Zones at the Sevilleta National Wildlife Refuge, New Mexico (1989-1998). https://portal.edirepository.org/nis/mapbrowse?scope=knb-lter-sev&identifier=200
Collins, S. L., Y. A. Chung, L. E. Baur, A. J. Hallmark, T. J. Ohlert, and J. A. Rudgers. 2020. Press–pulse interactions and long-term community dynamics in a Chihuahuan Desert grassland. Journal of Vegetation Science. https://doi.org/10.1111/jvs.12881
Chung, Y. A., S. L. Collins, and J. A. Rudgers. 2019. Connecting plant–soil feedbacks to long-term stability in a desert grassland. Ecology. https://doi.org/10.1002/ecy.2756
Chung, Y. A., A. Jumpponen, and J. A. Rudgers. 2018. Divergence in diversity and composition of root-associated fungi between greenhouse and field studies in a semiarid grassland. Microbial Ecology. https://doi.org/10.1007/s00248-018-1277-y
Root donuts:
Collins, S. 2016. Below-Ground Net Primary Production (BNPP): Root Ingrowth Donuts in Chihuahuan Desert Grassland and Creosote Shrubland at the Sevilleta National Wildlife Refuge, New Mexico (2005-present) ver 234833. Environmental Data Initiative. https://portal.edirepository.org/nis/mapbrowse?scope=knb-lter-sev&identifier=175
Methods to estimate plant biomass:
Sevilleta Plant Species Sensitivity of Dryland Plant Allometry to Climate. https://portal.edirepository.org/nis/mapbrowse?scope=knb-lter-sev&identifier=319
SEV Core Site Meteorological Data
Objective:
We collect hourly data from 12 meteorological stations placed strategically throughout the Sevilleta National Wildlife Refuge to maintain a long-term record of meteorological data.
Novelty:
Meteorological data have been collected at an hourly timescale at some stations since 1989. Over time, additional stations have been added to the network increasing the spatial scope on climate variables that influence ecosystem functioning. The most recent stations were installed in 2021 with an NSF infrastructure award led by Renée Brown.
Design:
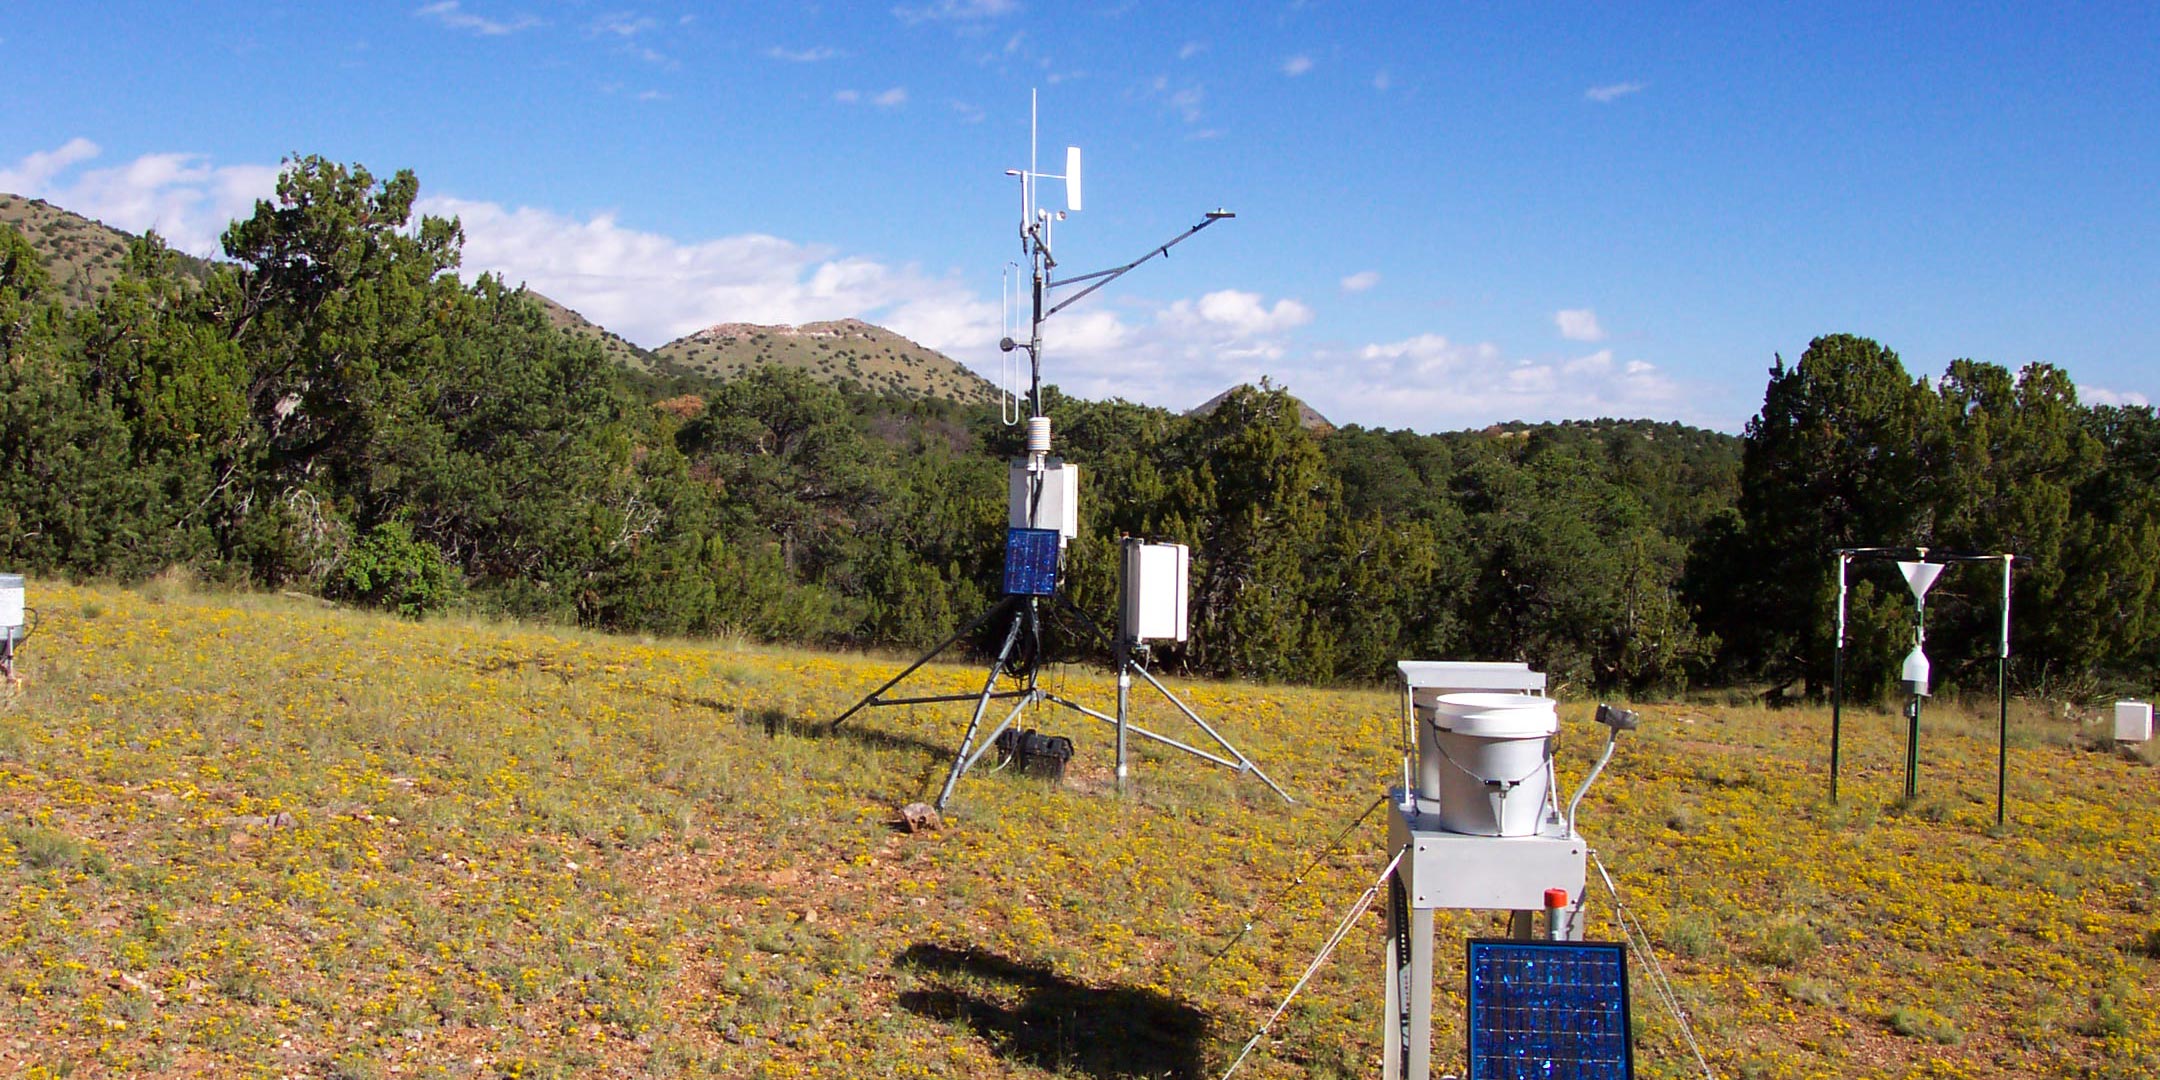
Meteorological stations collect weather data at hourly intervals. The stations are connected to a wireless network that transmits data from each station to the UNM Sevilleta Field Station server where it is available via the internet. Data are typically available within a few hours of being collected. Each weather station includes a 3 m tripod tower, on which is mounted most of the monitoring equipment. This equipment includes an enclosure housing a datalogger and power supply. On the tripod are mounted an anemometer and wind vane, a pyranometer, and a solar radiation shield that encloses a combination temperature and relative humidity sensor. Other attached sensors include: a precipitation gauge, soil temperature sensors and soil moisture potential sensors.


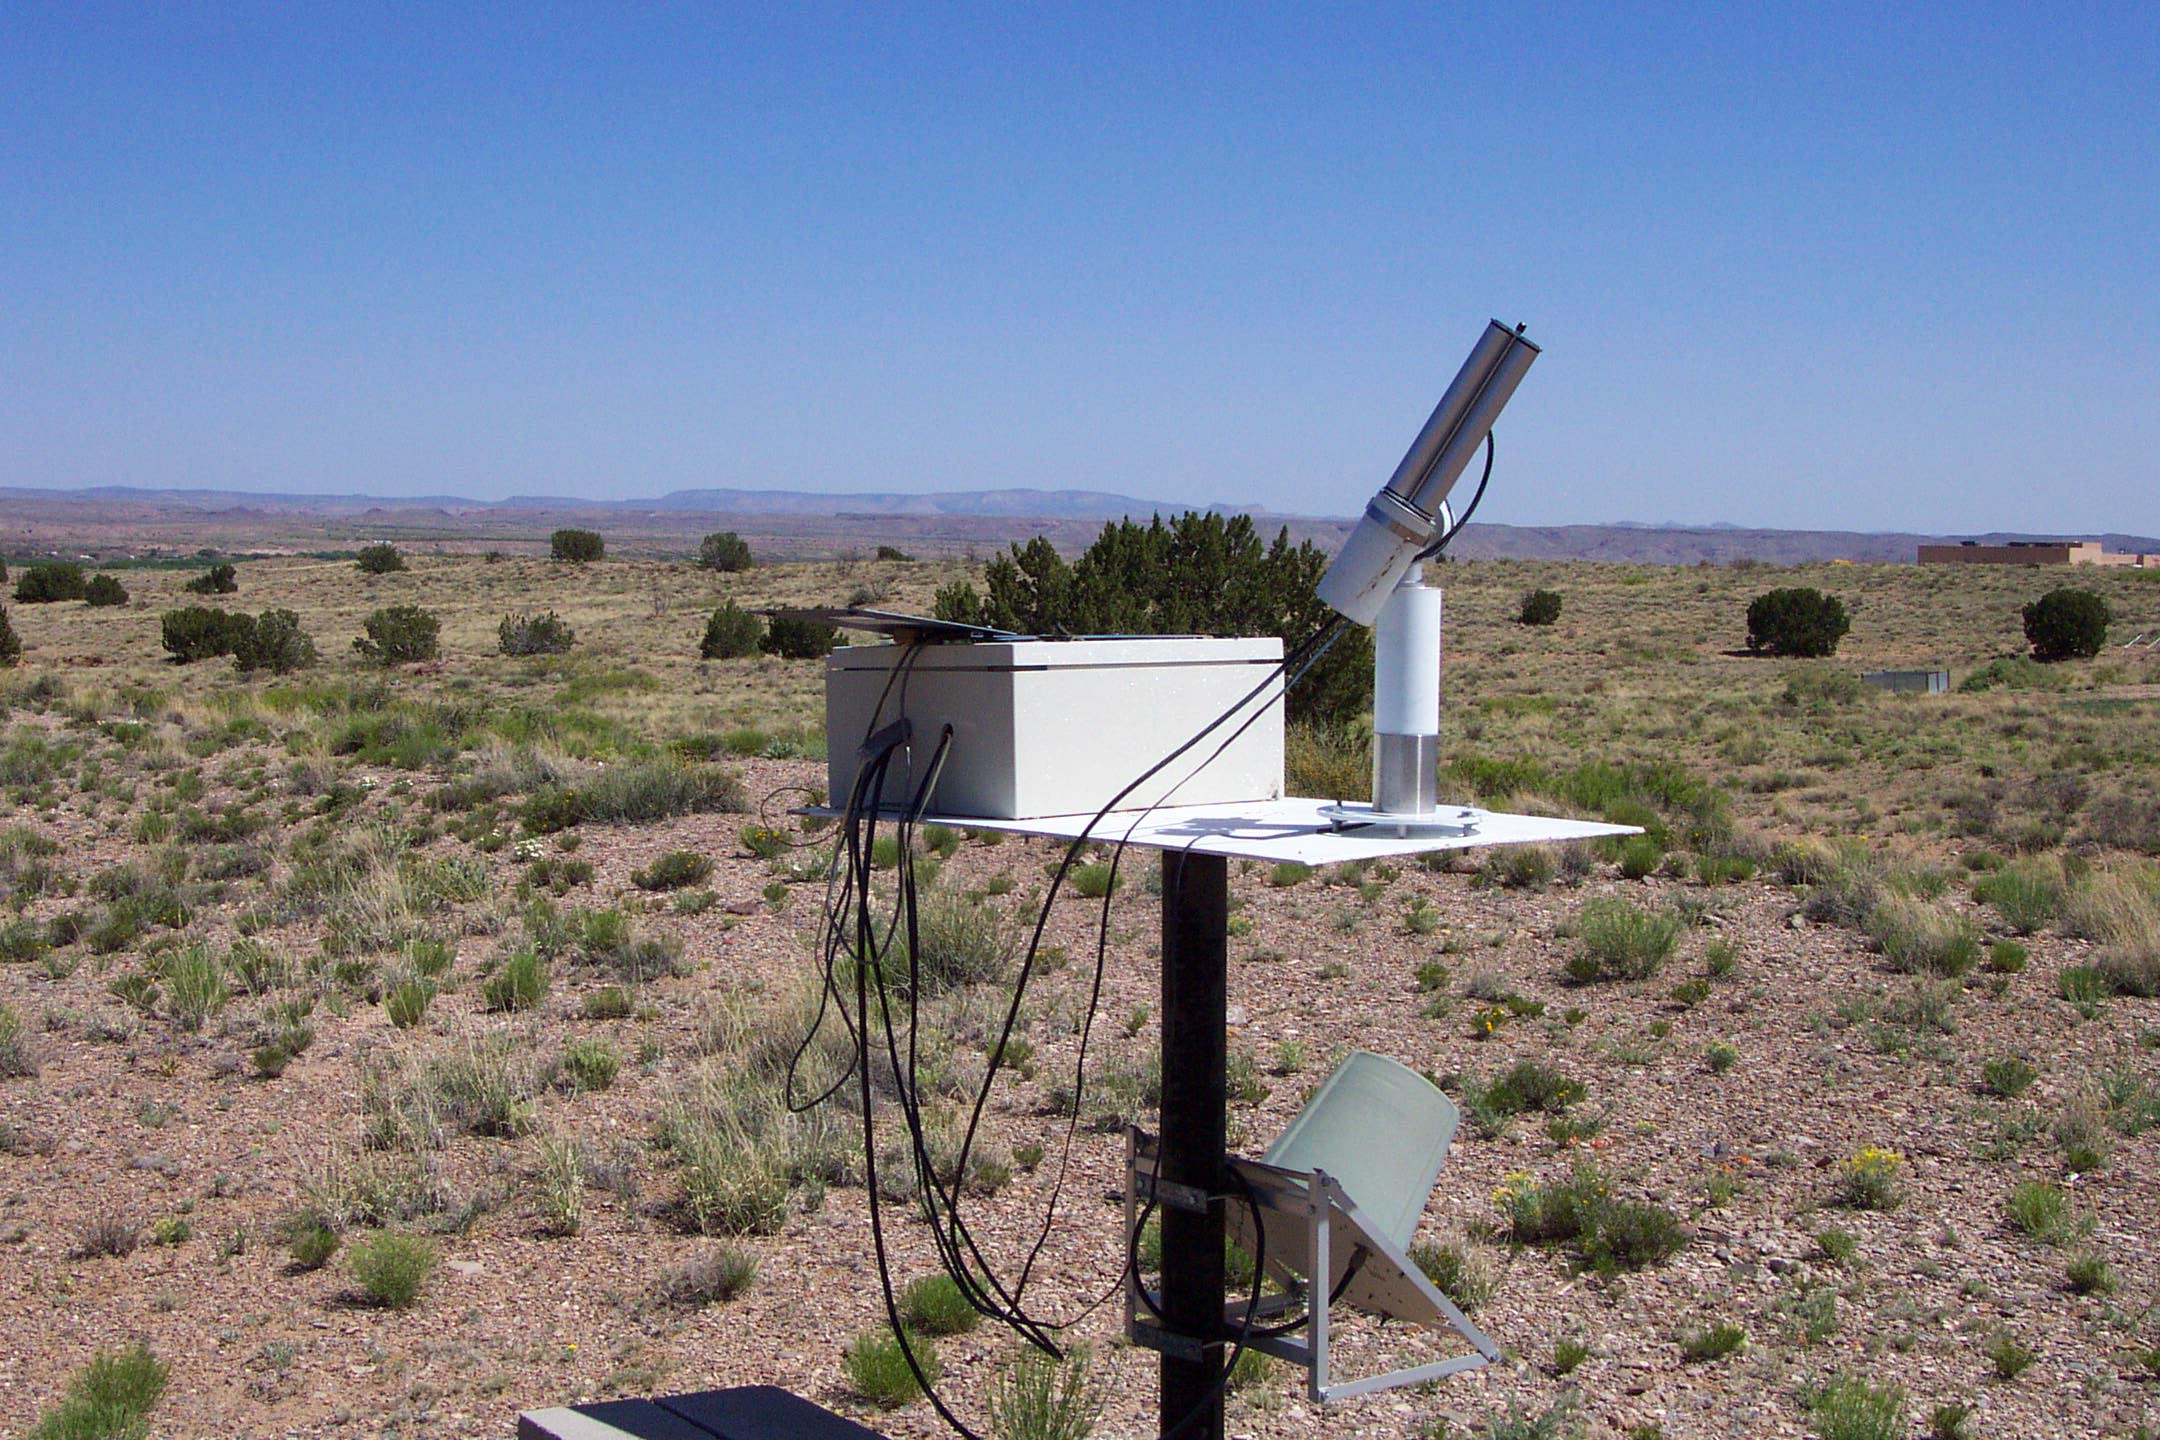
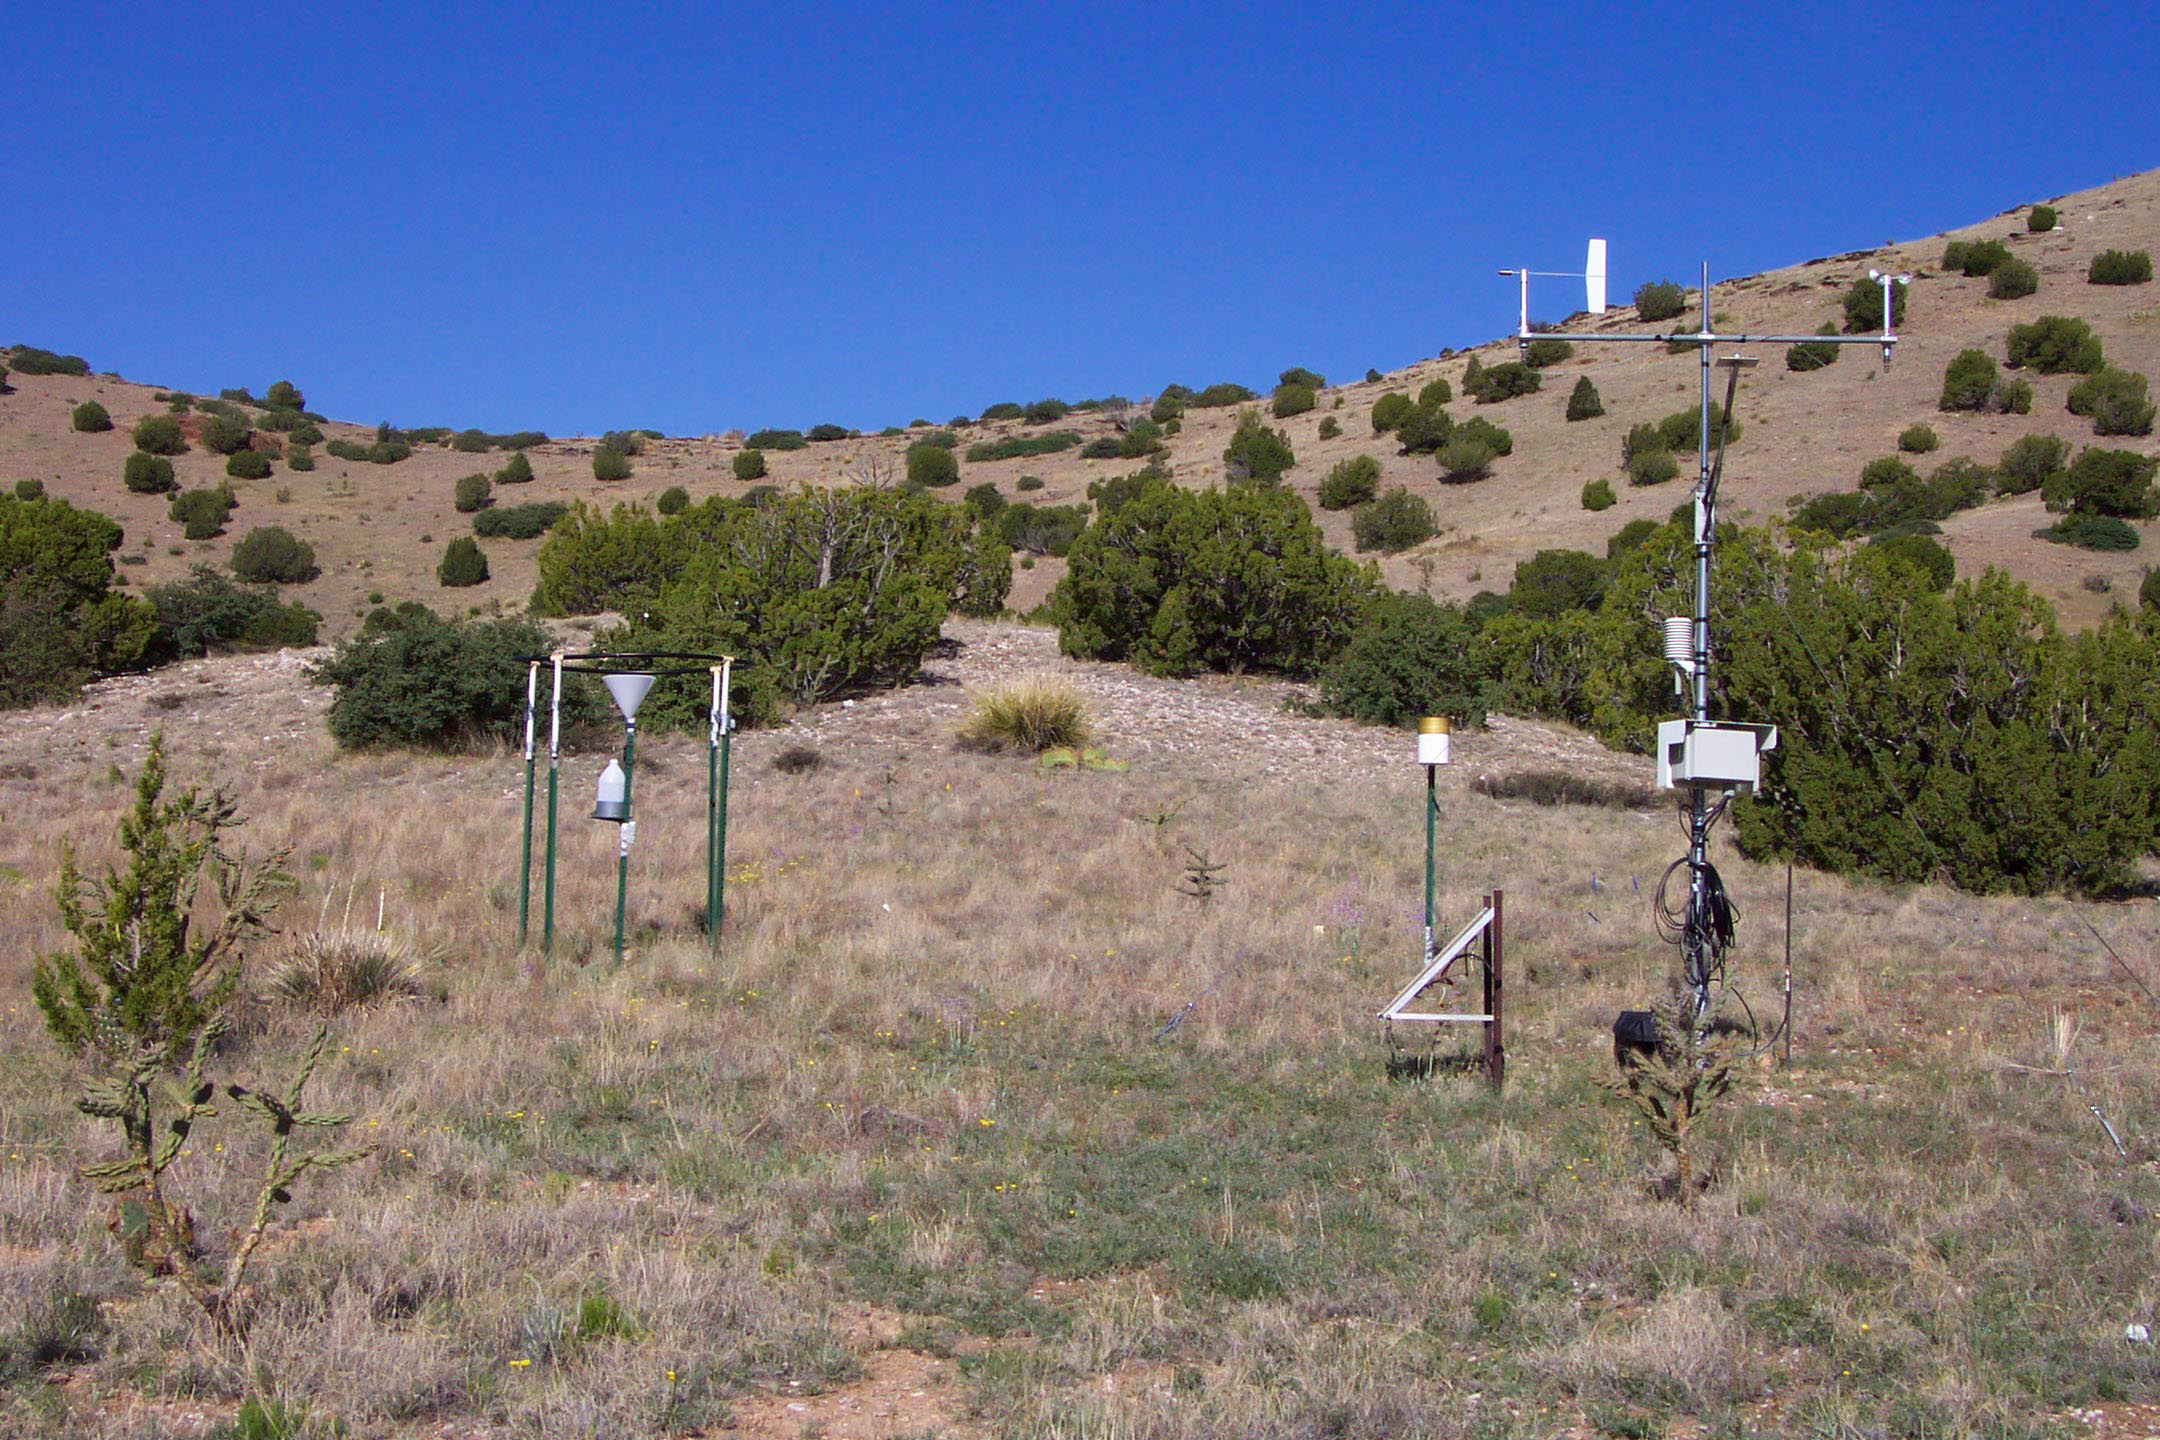
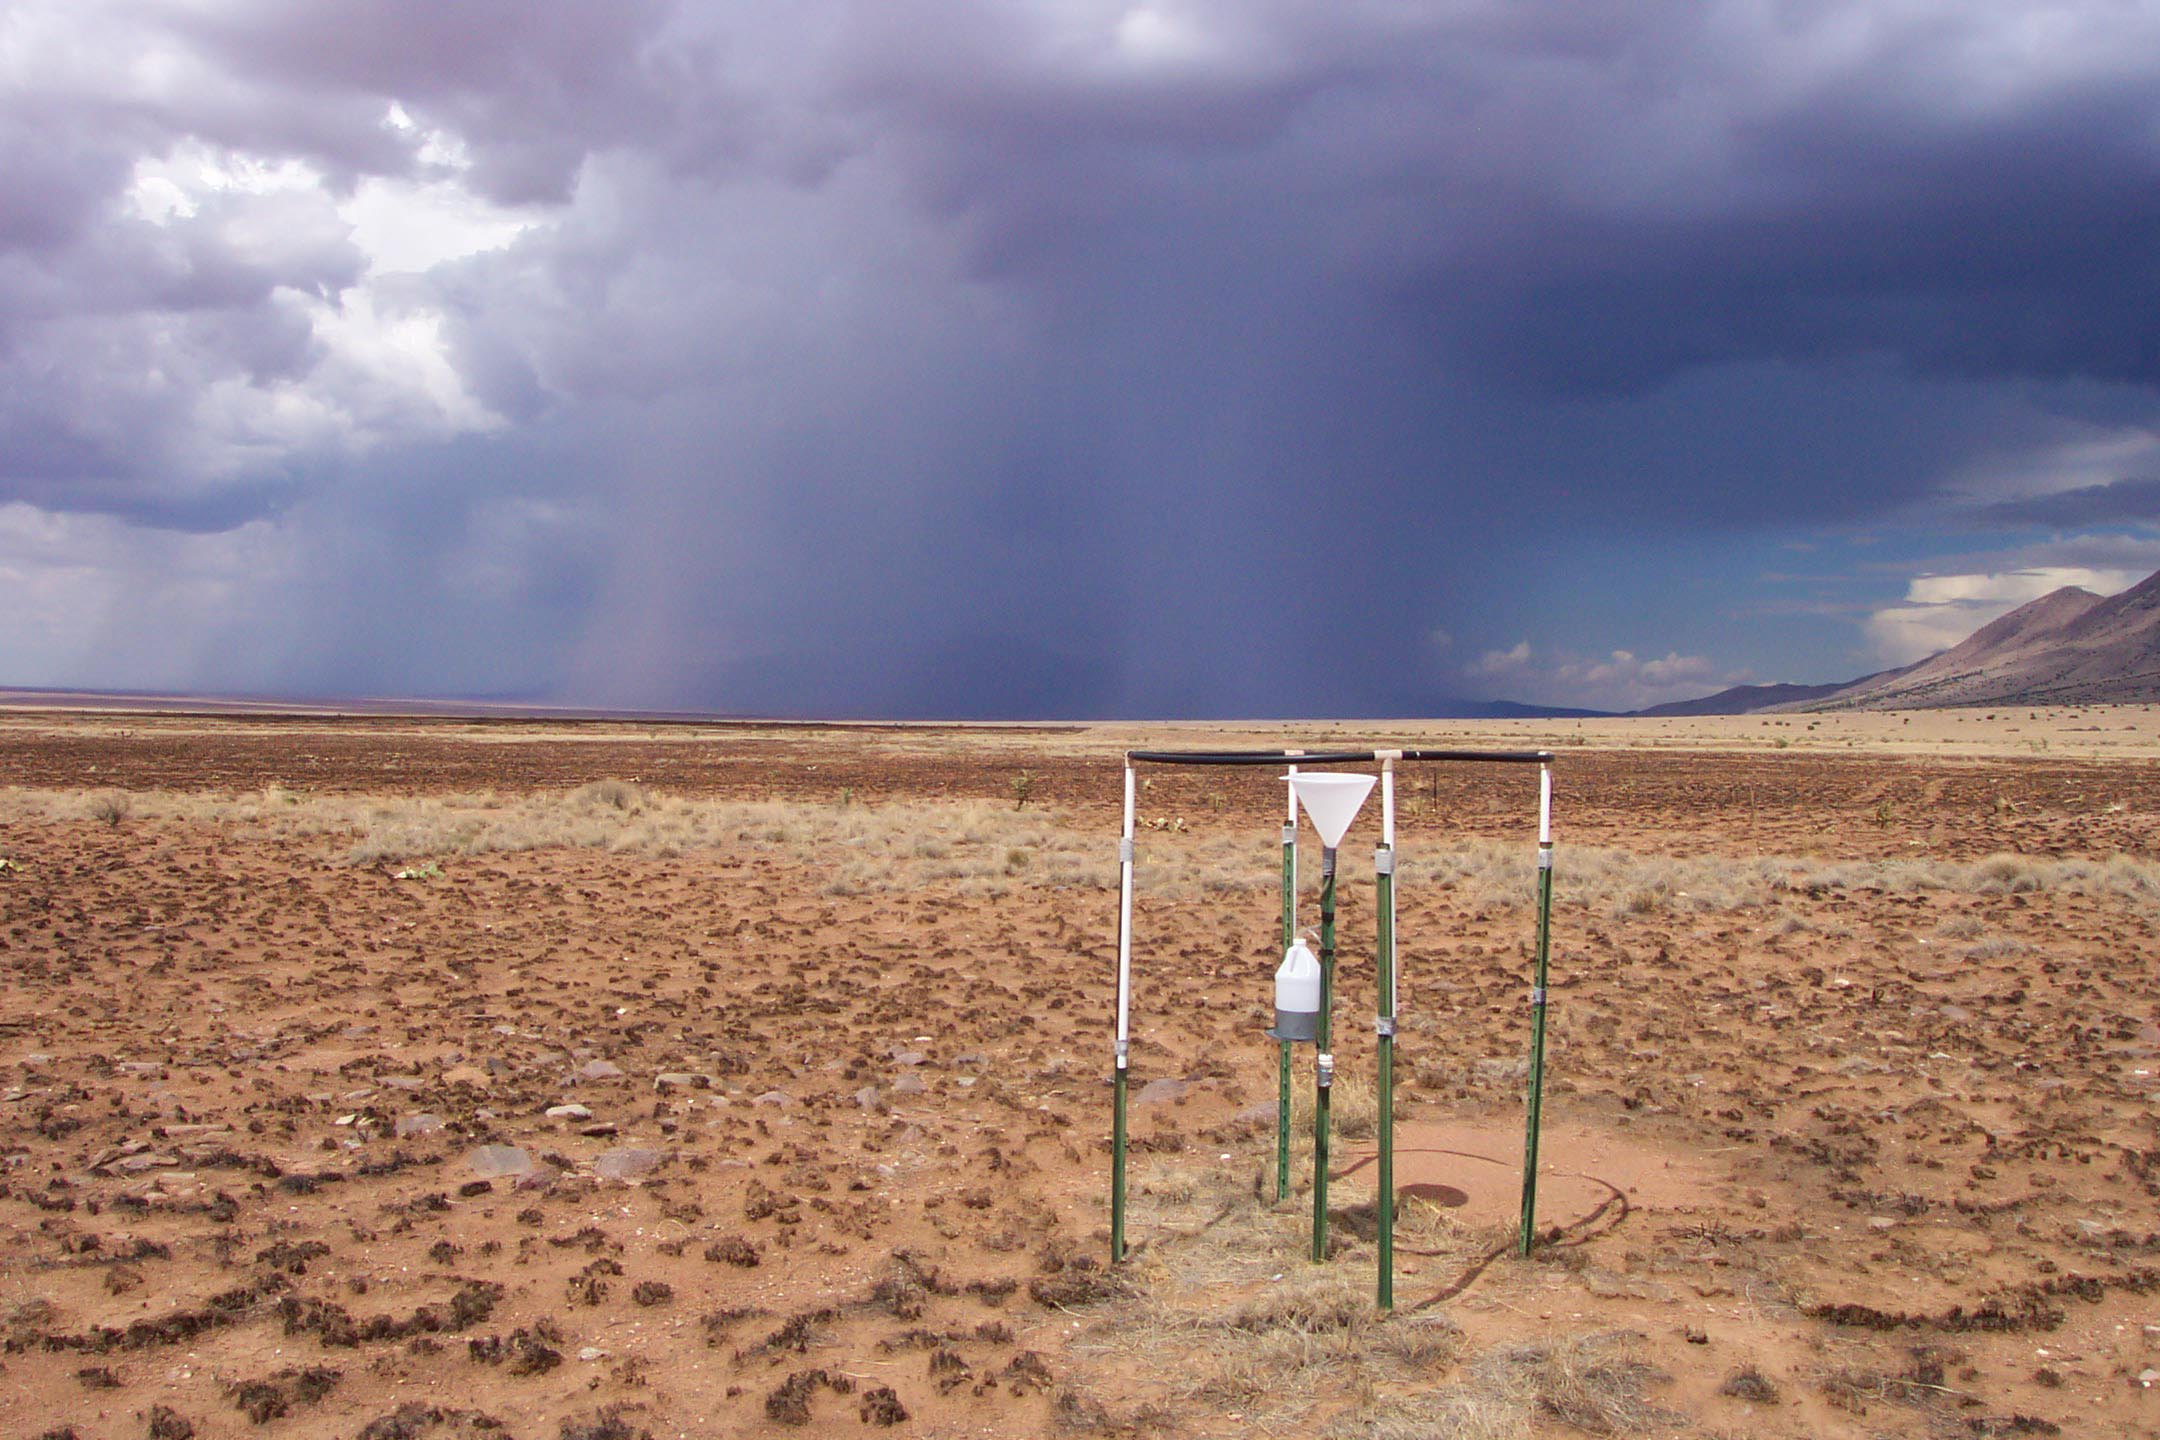
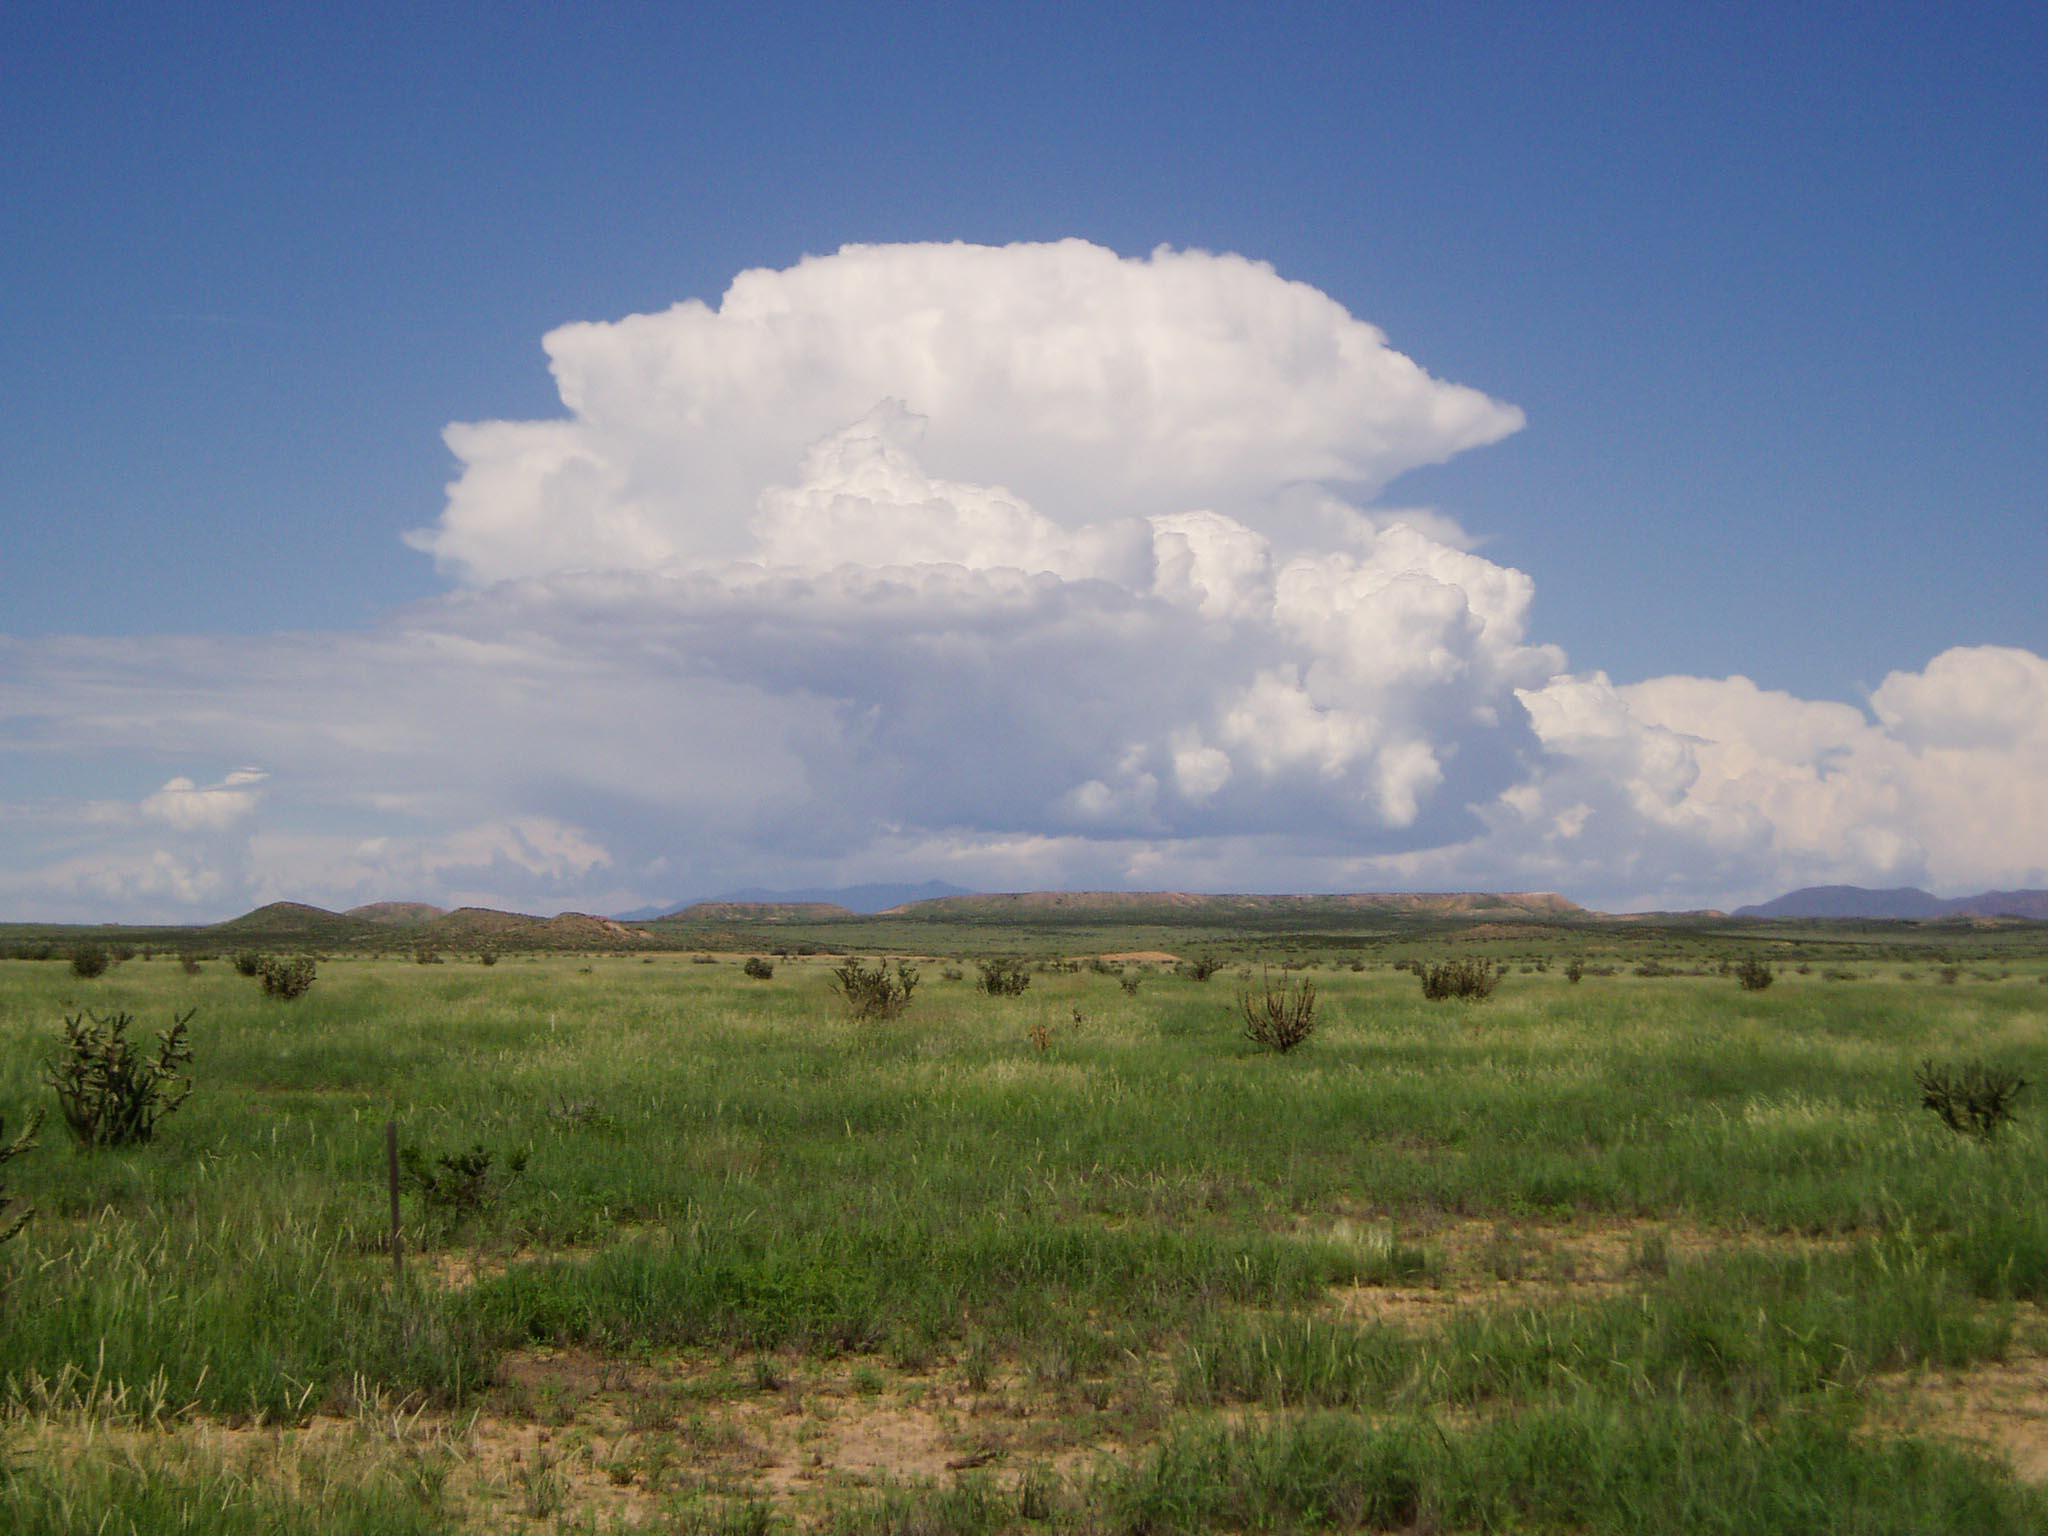

Automated meteorological stations and weather events.
Responses:
Currently, 12 meteorological stations collect some or all of the following variables on an hourly basis:
- Minimum, maximum, and mean air temperature
- Precipitation
- Minimum, maximum, and mean wind speed
- Vectored mean wind speed
- Wind direction and standard deviation
- 1 and 10 cm soil temperature
- Vapor pressure
- 10 and 30 cm soil moisture
- Minimum, maximum, and mean solar radiation
- Barometric pressure
We additionally support a network of Hobo rain gauges, 1-minute rain data, and NASA sun photometry data (located at the UNM Sevilleta Field Station).